

Why Network Monitoring Matters
Network downtime and performance issues can cripple your organization. This listicle presents the top 10 network monitoring tools available in 2025 to help you prevent such problems. We’ll explore key features, pros, cons, and pricing for each tool, empowering you to choose the best fit for your needs. This list covers popular options like Nagios, SolarWinds, PRTG, Zabbix, and more. Quickly identify the ideal network monitoring tools to maintain a healthy, secure, and efficient network.
1. Nagios
Nagios is a stalwart in the world of open-source network monitoring tools, earning its place on this list due to its comprehensive infrastructure monitoring capabilities and extensive customizability. It’s a powerful solution particularly well-suited for organizations in the AE region looking for a robust and adaptable system to monitor their complex IT infrastructures. Nagios provides essential monitoring and alerting services for a wide range of components, including servers, switches, applications, and services. This allows IT teams to proactively identify and resolve infrastructure problems before they impact critical business processes, minimizing downtime and ensuring smooth operations. For companies in the AE region experiencing rapid growth and digital transformation, Nagios can provide the necessary oversight to maintain stability and performance.
One of Nagios’s key strengths lies in its monitoring of all mission-critical infrastructure components. It provides in-depth visibility into the health and performance of your entire network, enabling you to pinpoint bottlenecks and potential issues quickly. The integrated alerting service promptly notifies administrators when problems arise, allowing for rapid response and remediation. Furthermore, the performance graphing feature allows for historical data analysis, providing valuable insights into long-term trends and potential areas for optimization. This is crucial for capacity planning and ensuring your infrastructure can handle future demands. You can Learn more about Nagios to explore its in-depth capabilities.
Nagios’s extensible architecture, supported by thousands of community-developed plugins, allows it to adapt to virtually any monitoring need. This makes it an exceptionally versatile network monitoring tool suitable for a wide range of businesses in the AE region, from startups to large enterprises. This ecosystem of plugins provides specialized monitoring capabilities for various applications, services, and devices, ensuring compatibility with your specific infrastructure setup.
Pros:
- Highly Customizable: The extensive plugin ecosystem allows for tailoring Nagios to specific monitoring needs.
- Strong Community Support: A large and active community provides ample resources, documentation, and assistance.
- Comprehensive Monitoring Capabilities: Monitors a wide range of infrastructure components, ensuring complete visibility.
- Free Core Version Available: Offers a cost-effective entry point for organizations to explore its features.
Cons:
- Steep Learning Curve: Requires significant time and effort to master the configuration and setup.
- Complex Configuration: Can be time-consuming and challenging, especially for complex environments.
- Outdated User Interface: The interface may feel less intuitive compared to more modern alternatives.
Pricing: Nagios Core is open-source and free. Nagios XI, the commercial version, offers advanced features and support with pricing based on the number of monitored devices.
Technical Requirements: Nagios can be installed on Linux servers. Specific hardware requirements vary depending on the size and complexity of the monitored environment.
Implementation Tips:
- Start with a small-scale deployment to familiarize yourself with the configuration and functionality.
- Leverage the extensive documentation and community resources available.
- Consider using pre-built plugins to simplify the monitoring of common services and applications.
- Invest in training for your IT team to maximize the effectiveness of Nagios.
Nagios offers a powerful and customizable solution for organizations requiring comprehensive network monitoring. While it has a steeper learning curve than some alternatives, its flexibility and extensive feature set make it a worthwhile investment for businesses in the AE region seeking granular control and in-depth visibility into their IT infrastructure. Its robust nature and community support solidify its position as a top contender in the realm of network monitoring tools.
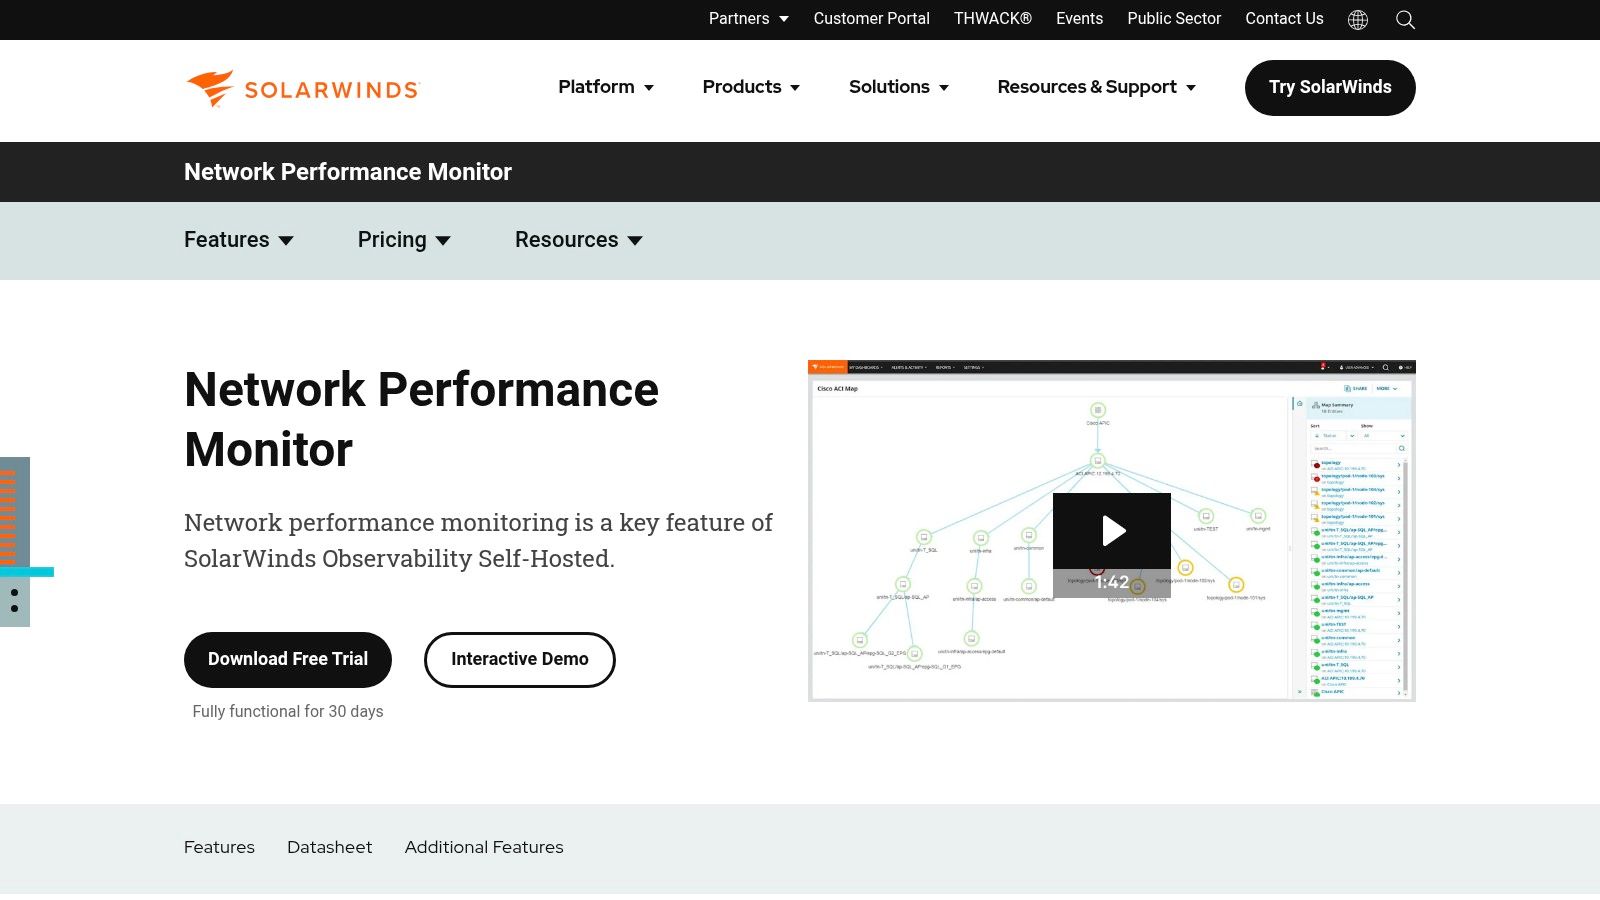
2. SolarWinds Network Performance Monitor
SolarWinds Network Performance Monitor (NPM) is a robust and comprehensive network monitoring tool designed to empower IT professionals in the AE region and beyond to swiftly detect, diagnose, and resolve network performance issues and outages. Whether you’re managing a small business network or a complex enterprise infrastructure, NPM provides powerful fault, availability, and performance monitoring capabilities. Its strength lies in proactively identifying potential problems before they impact end-users, ensuring smooth network operations and minimizing downtime. This makes it a valuable asset for any organization reliant on a stable and high-performing network.
For corporate IT departments in the AE region dealing with increasing network complexity, NPM offers granular visibility into network traffic, device health, and performance metrics. Network engineers and technicians can leverage its advanced features, such as network path analysis and NetFlow traffic analysis, to pinpoint bottlenecks and optimize bandwidth allocation. This level of detail allows for proactive troubleshooting and efficient capacity planning, essential for maintaining service levels and supporting business growth. Business owners and executives can benefit from the customizable dashboards and reports, gaining valuable insights into network health and ROI of IT investments. The tool’s scalability makes it suitable for telecommunication service providers and data center managers managing large and distributed networks.
Key Features and Benefits:
- Network Path Analysis and Critical Path Monitoring: Trace the route of network traffic to identify latency issues and potential points of failure. This is particularly beneficial in complex network environments where pinpointing the source of a problem can be challenging.
- NetFlow Traffic Analysis and Bandwidth Monitoring: Gain insights into bandwidth consumption by application, protocol, and user. This allows for optimized bandwidth allocation and identification of bandwidth hogs.
- Customizable Topology and Dependency-Aware Intelligent Alerts: Visualize network topology and dependencies, receiving alerts only for critical issues, reducing alert fatigue and ensuring prompt response to critical outages.
- Hardware Health Monitoring and Wireless Network Monitoring: Monitor the health of network devices, including servers, routers, and switches, as well as wireless access points and controllers. Proactive identification of hardware failures helps prevent costly downtime.
- Customizable Dashboards with Drag-and-Drop Widgets: Create personalized dashboards to visualize key performance indicators and gain a comprehensive overview of network health at a glance.
Pros:
- Intuitive Web Interface with Powerful Visualization Tools: Easy to navigate and use, even for non-technical users.
- Comprehensive Network Device Support: Supports a wide range of network devices from various vendors, simplifying network management.
- Scalable for Networks of All Sizes: Adapts to growing network needs, making it a suitable long-term investment.
- Excellent Customer Support: SolarWinds is known for its responsive and knowledgeable customer support.
Cons:
- Relatively High Cost Compared to Open-Source Alternatives: May be a significant investment for smaller organizations with limited budgets.
- Can be Resource-Intensive on Larger Networks: Requires adequate server resources for optimal performance, especially in large and complex environments.
- Some Advanced Features Require Additional Modules: Certain functionalities, such as advanced security monitoring, may require purchasing additional modules, adding to the overall cost.
Website: https://www.solarwinds.com/network-performance-monitor
Implementation and Setup Tips:
- Plan your deployment: Before installing NPM, assess your network infrastructure and identify key monitoring requirements.
- Utilize the available resources: SolarWinds provides extensive documentation and training resources to help with implementation and configuration.
- Start with basic monitoring and gradually expand: Begin by monitoring critical devices and services, and then gradually add more devices and functionalities as needed.
SolarWinds NPM earns its place on this list of top network monitoring tools due to its comprehensive feature set, intuitive interface, and scalability. While the cost may be a consideration, its robust capabilities and proactive monitoring features can significantly reduce downtime and improve network performance, ultimately delivering a strong return on investment for organizations in the AE region relying on robust network infrastructure. Alternatives like PRTG and ManageEngine OpManager offer similar functionalities, but NPM often stands out due to its breadth of features and user-friendly interface. For those seeking a powerful and comprehensive network monitoring solution, SolarWinds NPM deserves serious consideration.
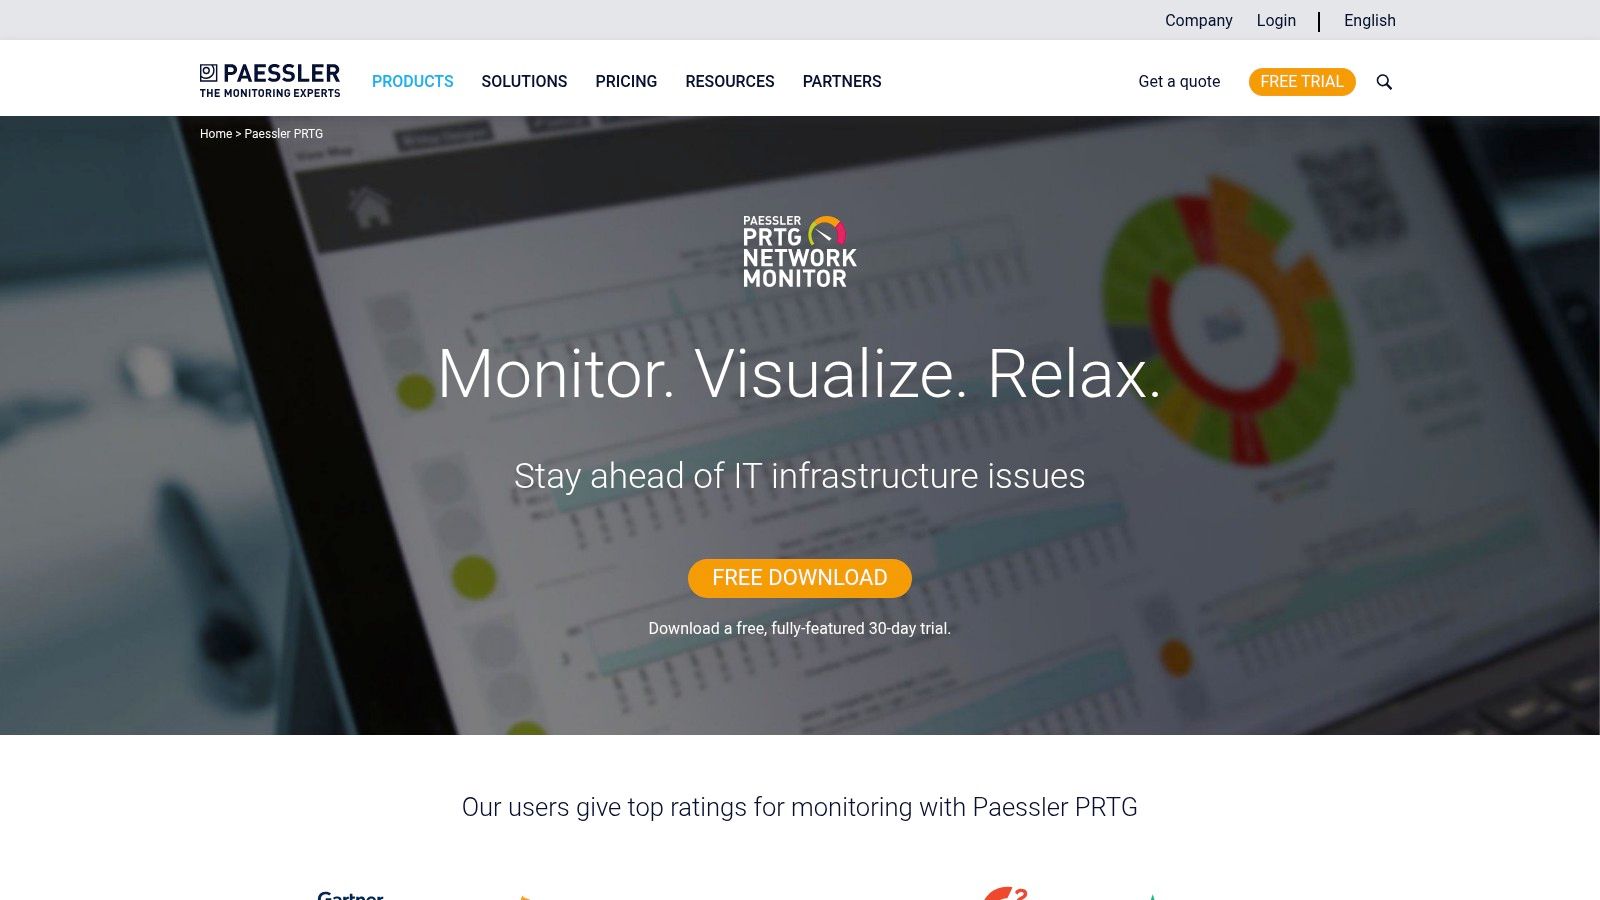
3. PRTG Network Monitor
PRTG Network Monitor by Paessler is a powerful and versatile network monitoring tool suitable for a wide range of organizations, from small businesses to large enterprises. It offers comprehensive monitoring of all systems, devices, traffic, and applications within your IT infrastructure. This all-in-one solution utilizes a variety of monitoring technologies, including SNMP, WMI, NetFlow, and packet sniffing, to provide a complete and detailed view of your network’s performance and availability. This makes it an excellent choice for businesses in the AE region seeking to maintain optimal network health and performance.
PRTG shines with its auto-discovery feature, automatically identifying devices and services on your network and creating corresponding sensors. This drastically simplifies the initial setup process. Imagine easily monitoring everything from servers and routers to bandwidth usage and application performance, all from a single, unified dashboard. The platform also boasts a flexible alerting system, notifying you via email, SMS, push notifications, or even executing custom scripts when critical thresholds are breached. Mobile apps for iOS and Android empower you to keep an eye on your network even while on the go. For a more tailored view, PRTG allows for customization of dashboards and maps to visualize your network according to your specific needs.
For organizations in the AE region dealing with complex IT infrastructures, PRTG’s unified monitoring of networks, systems, and applications is a significant advantage. Telecommunication service providers, for example, can leverage PRTG to monitor network devices, bandwidth utilization, and VoIP quality of service. Data center managers can track server health, environmental conditions, and power usage. Corporate IT departments can gain insights into application performance, network latency, and security vulnerabilities.
PRTG Network Monitor’s pricing is based on the number of sensors used. A free version is available for up to 100 sensors, making it a cost-effective solution for smaller businesses or for initial testing and evaluation. Learn more about PRTG Network Monitor As your network grows, you can purchase licenses for more sensors. While the pricing can become a factor for large networks requiring thousands of sensors, the comprehensive features and ease of use often justify the investment. Compared to similar tools like Zabbix and Nagios, PRTG requires less technical expertise for setup and configuration, making it more accessible to organizations with limited IT resources.
While PRTG offers pre-configured sensors for a wide range of devices and services, the customization options for advanced monitoring scenarios are somewhat limited compared to open-source alternatives. Another limitation is the Windows-only requirement for the core server installation. However, remote probes can be installed on other operating systems like Linux to monitor devices across your network.
Key Features and Benefits:
- Auto-Discovery: Automatically detects network devices and creates sensors.
- Unified Monitoring: Monitors networks, systems, and applications from a single platform.
- Flexible Alerting: Multiple notification methods and customizable thresholds.
- Mobile Apps: Monitor your network from anywhere.
- Customizable Dashboards: Tailor your view of network performance.
Pros:
- Easy setup and intuitive interface.
- Comprehensive monitoring with over 250 pre-configured sensors.
- Flexible licensing based on sensor count.
- Free version available for up to 100 sensors.
Cons:
- Can become expensive for large networks.
- Limited customization compared to some enterprise solutions.
- Windows-only core server installation.
Website: https://www.paessler.com/prtg
Implementation Tip: Start with the free version to explore PRTG’s capabilities and identify the specific sensors required for your network. Plan your sensor deployment carefully to optimize licensing costs as you scale. Utilize the pre-configured sensors whenever possible and explore the customizable options for more specific monitoring needs. Leverage the mobile apps for convenient remote monitoring and alerting.
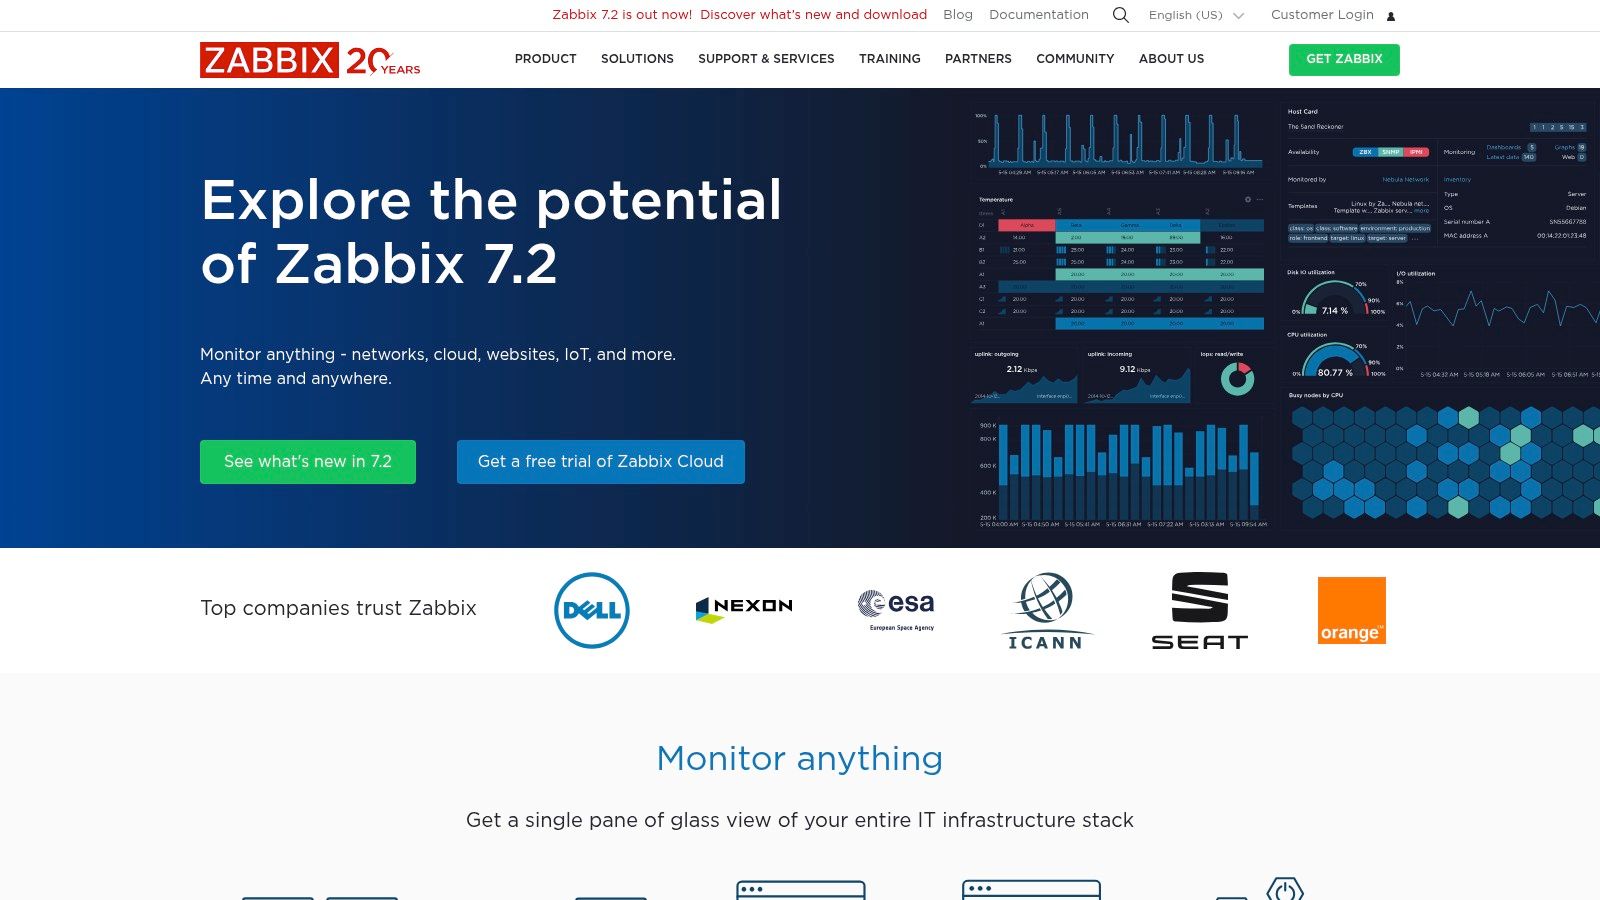
4. Zabbix: Robust Open-Source Network Monitoring for the Enterprise
Zabbix stands out as a leading enterprise-class open-source distributed monitoring solution designed for comprehensive oversight of IT infrastructure availability and performance. Whether you’re monitoring networks, servers, virtual machines, or cloud services in the AE region, Zabbix provides a powerful and flexible platform to ensure the health and stability of your critical systems. Its ability to collect and analyze a wide array of metrics makes it a valuable tool for corporate IT departments, network engineers, business owners, telecom providers, and data center managers alike. Zabbix’s focus on real-time monitoring, predictive analytics, and auto-discovery makes it a compelling choice for those seeking a robust yet cost-effective network monitoring solution.
Zabbix earns its place on this list due to its comprehensive feature set, open-source nature, and scalability. It offers distributed monitoring, allowing you to monitor large and complex networks with ease. High-performance real-time monitoring ensures you’re aware of issues as they arise, enabling swift responses to potential problems. The platform’s powerful visualization capabilities, including customizable graphs and maps, offer clear and concise insights into your network’s performance. Furthermore, Zabbix’s predictive analytics with trend forecasting help anticipate potential issues before they impact your operations. Auto-discovery of network devices and services simplifies initial setup and ongoing maintenance, while agentless monitoring support provides flexibility in how you monitor your infrastructure.
Key Features and Benefits for the AE Region:
- Scalability and Distributed Monitoring: Ideal for large organizations and distributed networks common in the AE region, Zabbix can handle a large number of monitored devices.
- Multilingual Support: Essential for diverse teams across the AE region, Zabbix offers support for multiple languages, simplifying adoption and usage.
- Real-Time Monitoring and Alerting: Enables immediate responses to critical network events, minimizing downtime and ensuring service continuity.
- Predictive Analytics: Provides insights into future trends, allowing proactive mitigation of potential problems and optimizing resource allocation.
- Integration with Existing Systems: Zabbix integrates with various other tools and platforms, enabling seamless incorporation into existing workflows.
Technical Requirements and Implementation:
Zabbix requires a server running Linux or Unix to operate. While the application itself is free, setting up and maintaining the server requires technical expertise. Implementing Zabbix can be complex initially, requiring careful planning and configuration. While agentless monitoring is supported, deploying Zabbix agents on monitored devices is often recommended for more detailed data collection.
Pros:
- Completely Open-Source: No licensing fees, allowing for significant cost savings.
- Highly Scalable: Suitable for both small and large environments.
- Flexible Notification and Alerting: Customize notifications to fit your specific needs.
- Active Community and Regular Updates: Ensures ongoing development and support.
Cons:
- Complex Initial Setup: Can be challenging for users without technical expertise.
- Steeper Learning Curve: Requires time and effort to master.
- Documentation Can Be Inconsistent: Some areas may require additional research or community support.
Comparison with Similar Tools:
While commercial alternatives like Nagios XI and SolarWinds offer polished interfaces and potentially simpler setup, Zabbix provides a comparable feature set at no cost. For organizations in the AE region looking for a cost-effective and powerful monitoring solution, Zabbix offers a compelling alternative to paid tools.
Setup Tips:
- Start with a small test environment to familiarize yourself with Zabbix’s configuration.
- Utilize the official documentation and community forums for support.
- Consider engaging a Zabbix consultant for complex deployments.
Website: https://www.zabbix.com/
Zabbix presents a powerful and versatile network monitoring tool particularly well-suited for the diverse needs of the AE region. Its open-source nature, combined with its extensive features and scalability, make it an ideal choice for organizations seeking a robust and cost-effective solution. While the initial setup can be complex, the benefits of comprehensive network monitoring and predictive analytics make Zabbix a worthwhile investment for businesses looking to maintain optimal IT infrastructure performance.
5. Wireshark
Wireshark is a cornerstone in the world of network monitoring tools, earning its place as the industry standard for protocol analysis. It provides an unparalleled level of detail into network traffic, making it indispensable for troubleshooting, security analysis, and deep dives into network behavior. This open-source powerhouse empowers users to dissect network communications at a microscopic level, inspecting hundreds of protocols and revealing the intricate workings of their networks. For IT professionals in the AE region dealing with complex network infrastructures, Wireshark offers a vital toolset for understanding and optimizing performance.
Practical Applications and Use Cases:
- Troubleshooting Network Issues: Wireshark excels at pinpointing the root cause of network problems. Whether it’s slow connections, dropped packets, or application latency, analyzing captured traffic with Wireshark provides invaluable insights. For example, telecommunication service providers in the AE region can utilize Wireshark to identify bottlenecks and optimize network performance for their customers.
- Security Monitoring: By examining network packets, security professionals can identify suspicious activity, malware infections, and data breaches. Wireshark’s deep packet inspection allows for the analysis of protocols used in attacks, helping to fortify network defenses. This is crucial for corporate IT departments in the AE region, protecting sensitive data and ensuring compliance.
- VoIP Analysis: Wireshark offers rich VoIP analysis features, allowing examination of call quality, jitter, and latency issues. This is especially relevant for businesses in the AE region heavily reliant on VoIP communication.
- Network Performance Optimization: By analyzing network traffic patterns, Wireshark assists in optimizing network performance. Data center managers can use it to identify bandwidth hogs and improve resource allocation.
- Education and Training: Wireshark is an excellent educational tool for network engineers and technicians. It provides a practical way to learn about network protocols and how network communication functions.
Features and Benefits:
- Deep Packet Inspection: Analyze hundreds of protocols, from common TCP/IP traffic to specialized industrial protocols.
- Live Capture and Offline Analysis: Capture network traffic in real-time or analyze pre-recorded capture files.
- Multi-Platform Support: Works across Windows, Linux, macOS, and other operating systems, catering to diverse environments common in the AE region.
- Powerful Display Filters: Filter captured data to isolate specific protocols, conversations, or errors, simplifying complex analysis.
- Rich VoIP Analysis: Dedicated features for analyzing VoIP traffic, identifying quality issues and troubleshooting call problems.
Pros:
- Free and Open-Source: No licensing costs, making it accessible to businesses and individuals of all sizes.
- Detailed Packet Analysis: Unmatched level of detail in packet inspection for comprehensive analysis.
- Community Support: Active community and regular updates ensure ongoing development and assistance.
Cons:
- Steep Learning Curve: Requires significant networking knowledge for effective use.
- Overwhelming for Beginners: The interface and sheer volume of data can be daunting for new users.
- Limited Alerting: Lacks the built-in alerting capabilities of dedicated network monitoring tools.
Technical Requirements:
Wireshark runs on various operating systems, including Windows, macOS, and Linux. Hardware requirements are minimal, with any modern computer capable of running the software. However, for capturing high-volume traffic, a dedicated network tap or port mirroring configuration is recommended.
Comparison with Similar Tools:
While tools like tcpdump offer command-line packet capture, Wireshark provides a user-friendly graphical interface and more extensive analysis features. Commercial network monitoring tools offer more advanced alerting and reporting features but often come with significant licensing costs.
Implementation/Setup Tips:
- Start with tutorials and online resources to familiarize yourself with the interface and filtering options.
- Use capture filters to limit the amount of data captured, improving performance and simplifying analysis.
- Leverage the extensive online documentation and community forums for support.
Website: https://www.wireshark.org/
Wireshark’s power and versatility make it an essential network monitoring tool, especially for technical teams in the AE region requiring deep packet analysis capabilities. While the learning curve can be steep, the wealth of information it provides makes it an invaluable asset for maintaining and securing complex networks.
6. Datadog Network Performance Monitoring
Datadog Network Performance Monitoring earns its place on this list of top network monitoring tools due to its comprehensive visibility and powerful analytics. It provides a unified platform to monitor network traffic flowing across diverse environments, from public clouds like AWS, Azure, and GCP, to private networks and hybrid infrastructures. This makes it an ideal solution for organizations operating in complex, distributed environments common in the AE region, where cloud adoption is rapidly increasing and hybrid setups are prevalent. Datadog goes beyond basic monitoring by correlating network performance data with application and service-level metrics, enabling teams to quickly identify and resolve performance bottlenecks and outages. This holistic approach is crucial for maintaining optimal application performance and user experience in today’s demanding digital landscape.
One of Datadog’s key strengths is its real-time network traffic visualization. Network engineers can gain immediate insights into traffic patterns, identify bandwidth hogs, and pinpoint latency issues. This is especially valuable for telecommunication service providers and data center managers in the AE region managing high-traffic networks and requiring real-time monitoring for proactive issue resolution. The automatic network topology mapping feature with service discovery automatically visualizes network connections and dependencies, simplifying troubleshooting in complex environments. For corporate IT departments supporting a large number of applications, this visualization is critical for understanding inter-service communication and quickly isolating faulty components.
Datadog shines in its integration capabilities. Seamlessly integrating with over 450 technologies, including other Datadog monitoring tools, provides a centralized view of IT infrastructure. This unified platform streamlines monitoring and troubleshooting for network engineers and IT technicians by providing a single pane of glass for all relevant data. Specifically for business owners and executives in the AE region, this integration translates to improved operational efficiency and reduced downtime.
While Datadog offers a compelling suite of features, it’s important to consider the cost and complexity. It has a higher price point compared to standalone network monitoring tools. Pricing is based on ingested data and infrastructure monitored, making it essential to carefully evaluate your needs and budget. Furthermore, achieving comprehensive monitoring requires installing the Datadog agent, which may introduce additional overhead. Initial setup and configuration can also be complex, potentially requiring specialized expertise. However, the rich features and benefits often outweigh these considerations for organizations needing advanced network monitoring capabilities.
Key Features and Benefits:
- Real-time Network Traffic Visualization: Monitor network flows and identify performance bottlenecks quickly.
- Application and Network Performance Correlation: Pinpoint the root cause of performance issues by correlating network data with application metrics.
- Cloud Network Monitoring: Monitor network performance across AWS, Azure, and GCP.
- Network Topology Mapping: Visualize network connections and dependencies automatically.
- Integration with 450+ Technologies: Consolidate monitoring within the Datadog platform.
Pros:
- Seamless integration with other Datadog monitoring tools.
- Modern and intuitive user interface.
- Excellent support for cloud and container environments.
- Advanced analytics and anomaly detection.
Cons:
- Higher price point compared to standalone solutions.
- Requires agent installation for comprehensive monitoring.
- Can be complex to set up and configure optimally.
Website: https://www.datadoghq.com/product/network-monitoring/
Implementation Tip: Start by monitoring critical applications and services to gain immediate value. Gradually expand monitoring coverage as needed. Utilize Datadog’s documentation and support resources to optimize configuration and leverage advanced features.
7. ManageEngine OpManager
ManageEngine OpManager is a powerful and comprehensive network monitoring tool well-suited for organizations in the AE region looking to gain real-time visibility into their network infrastructure. It offers a robust suite of features designed to monitor the performance of network devices, servers, and applications, providing valuable insights into bandwidth usage, traffic patterns, and device health with minimal initial configuration. This makes it an excellent choice for businesses ranging from small to large enterprises, particularly appealing to those seeking a user-friendly solution with a relatively quick setup.
For IT teams in the AE region grappling with increasingly complex network environments, OpManager provides a centralized platform for managing and troubleshooting network issues. Its automated network discovery and mapping capabilities quickly identify and document all connected devices, simplifying network administration. Real-time monitoring and alerting features ensure that network engineers are immediately notified of any performance degradation or outages, allowing for swift action to minimize downtime. Bandwidth analysis and traffic monitoring tools provide granular insights into network usage patterns, which can be instrumental in optimizing network performance and identifying potential bottlenecks. Furthermore, the built-in troubleshooting tools, including ping and traceroute, offer readily available resources for diagnosing and resolving connectivity problems.
OpManager’s fault management system goes beyond basic alerts by providing root cause analysis, helping network technicians identify the underlying source of issues quickly. This can significantly reduce the time spent troubleshooting and improve overall network stability. For businesses in the AE region relying heavily on their network infrastructure, minimizing downtime and ensuring consistent performance is crucial. OpManager’s robust feature set addresses this need effectively. You can Learn more about ManageEngine OpManager to understand how it caters to specific business requirements.
Key Features and Benefits:
- Real-Time Monitoring and Alerting: Proactively identifies and alerts on performance issues.
- Automated Network Discovery and Mapping: Automatically discovers and maps network devices, simplifying management.
- Bandwidth Analysis and Traffic Monitoring: Provides detailed insights into bandwidth utilization and traffic flow.
- Fault Management with Root Cause Analysis: Helps identify the root cause of network issues, facilitating faster resolution.
- Integrated IP Address Management: Simplifies IP address allocation and tracking.
- User-Friendly Interface: Easy to navigate and use, minimizing the learning curve for new users.
Pros:
- Intuitive interface with minimal training required.
- Comprehensive device support with pre-built templates for major vendors.
- Competitive pricing and good value for its feature set.
- Integrated IP address management simplifies network administration.
Cons:
- Some advanced functionalities require additional licensing costs.
- Reporting flexibility could be improved.
- The mobile application offers limited functionality compared to the web interface.
While pricing details may vary depending on specific requirements and deployment size, ManageEngine offers flexible licensing options to suit various budgets. For detailed pricing information and to explore how OpManager can benefit your organization in the AE region, visiting the official website is recommended. OpManager deserves its place on this list due to its comprehensive features, user-friendly design, and ability to provide valuable insights into network performance, making it a strong contender for businesses looking to streamline their network monitoring processes. It caters specifically to the needs of corporate IT departments, network engineers, business owners, telecom providers, and data center managers by offering a centralized platform for managing and optimizing complex network infrastructures.
8. Prometheus
Prometheus stands out as a leading open-source network monitoring tool, particularly excelling in dynamic, containerized environments. Built for modern, service-oriented architectures, it provides a robust platform for collecting, analyzing, and acting upon time-series metrics, making it an indispensable asset for organizations embracing cloud-native technologies. Its position in this list is cemented by its specific strengths in handling microservices and its scalability, making it a powerful choice for complex network monitoring within the AE region.
One of Prometheus’s core strengths lies in its multi-dimensional data model. Unlike traditional monitoring systems that rely on rigid schemas, Prometheus uses metric names and key/value pairs to identify time series data. This flexibility allows for granular monitoring of various aspects of your network infrastructure, from individual container performance to overall network latency. This is particularly crucial in the AE region, where the rapid adoption of cloud technologies and microservices necessitates a highly adaptable network monitoring solution.
Its powerful query language, PromQL, allows for complex queries and real-time analysis of collected metrics. Network engineers and technicians can leverage PromQL to investigate performance bottlenecks, identify anomalies, and gain deep insights into network behavior. Imagine being able to quickly pinpoint the source of latency issues within a specific microservice during peak traffic – Prometheus, with PromQL, makes this possible.
Prometheus employs a pull-based metrics collection method, discovering and scraping metrics from configured targets at regular intervals. This approach simplifies deployment and reduces the burden on monitored systems. Further enhancing its scalability, each Prometheus server operates autonomously, eliminating single points of failure and ensuring resilience even in large, distributed environments prevalent in many AE organizations. This architecture also simplifies scaling; adding more Prometheus servers is straightforward as your monitoring needs grow.
For visualizing collected data, Prometheus seamlessly integrates with Grafana, a popular open-source visualization platform. This allows users to create customized dashboards and alerts, transforming raw metrics into actionable insights. Visualizing complex network data in a clear and concise manner empowers IT teams to proactively manage network performance and swiftly respond to emerging issues.
Pricing and Technical Requirements: Prometheus is completely open-source and free to use. Deploying Prometheus requires a server running a Linux-based operating system. Basic familiarity with command-line interfaces and containerization technologies like Docker and Kubernetes can be beneficial for setup and management, particularly for more complex deployments.
Comparison with Similar Tools: While tools like Nagios and Zabbix offer more traditional, host-centric monitoring, Prometheus shines in dynamic, cloud-native environments. Its focus on metrics, combined with its pull-based architecture and scalability, makes it a better fit for microservices and container orchestration platforms like Kubernetes.
Implementation/Setup Tips: Start by identifying the key metrics you need to monitor for your network. Configure Prometheus to scrape these metrics from relevant targets. Leverage service discovery mechanisms to automatically detect and monitor new services within your environment. Finally, integrate with Grafana to create informative dashboards and alerts for effective visualization and proactive monitoring.
Pros:
- Ideal for cloud-native and microservices environments.
- Highly scalable architecture.
- Strong community support and a rich ecosystem.
- Free and open-source.
Cons:
- Primarily focuses on metrics; separate solutions are needed for logs and traces.
- Can present a learning curve for teams accustomed to traditional monitoring tools.
- Basic data retention and dashboarding features are limited, often requiring integration with Grafana or other tools.
Website: https://prometheus.io/
Prometheus offers a robust, scalable, and cost-effective solution for network monitoring, especially in modern, dynamic environments increasingly adopted across the AE region. Its focus on metrics, powerful query language, and seamless integration with visualization tools like Grafana make it a valuable addition to any organization’s network monitoring toolkit.
9. LogicMonitor
LogicMonitor is a robust, cloud-based network monitoring tool ideal for organizations seeking comprehensive visibility and control over their IT infrastructure. It offers a full-stack approach, meaning it monitors everything from network devices and servers to cloud resources and applications, making it a powerful solution for complex, hybrid environments common in the AE region. LogicMonitor distinguishes itself with its automated, agentless approach, significantly reducing the manual configuration burden often associated with network monitoring tools. This makes it a particularly attractive option for businesses looking to streamline their IT operations and reduce overhead.
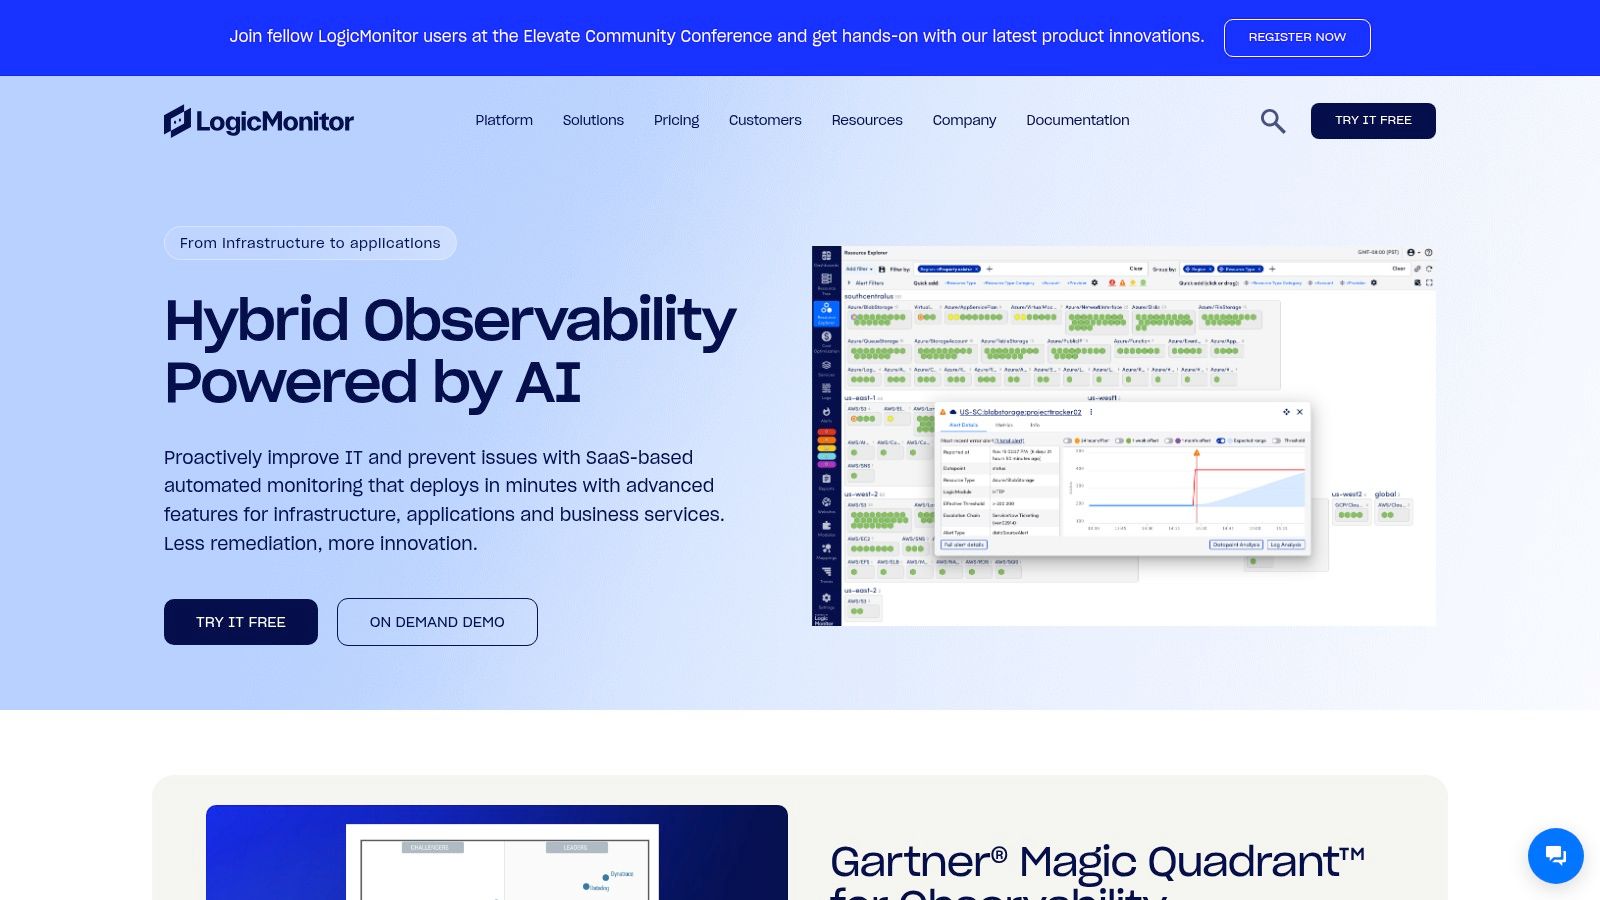
This platform earns its place on this list due to its extensive automated discovery and monitoring capabilities. It automatically identifies and begins monitoring new resources as they are added to your network, ensuring comprehensive coverage without constant manual intervention. This is particularly beneficial for dynamic cloud environments where resources are frequently spun up and down. Leveraging pre-configured monitoring templates for thousands of technologies, from Cisco routers and VMware hosts to AWS services and Azure databases, LogicMonitor quickly provides valuable insights into performance metrics across your entire IT stack. This allows IT teams in the AE region to focus on critical issues rather than spending valuable time configuring individual monitoring checks.
For advanced users, LogicMonitor’s AIOps capabilities, including anomaly detection and forecasting, offer proactive insights to prevent potential outages and optimize resource utilization. The integrated configuration management and topology mapping functionalities provide a clear picture of your infrastructure’s interconnectedness, simplifying troubleshooting and impact analysis. Comprehensive alert management with escalation workflows ensures the right team members are notified of critical issues, facilitating faster response times and minimizing downtime.
Practical Applications:
- Telecommunication Service Providers in the AE region: Monitor network performance, identify bottlenecks, and proactively address issues to ensure high-quality service delivery.
- Data Center Managers: Gain full visibility into server health, environmental conditions, and resource utilization to optimize data center operations.
- Corporate IT Departments: Monitor on-premises and cloud infrastructure, track application performance, and ensure compliance with SLAs.
- Business Owners and Executives: Get a high-level overview of IT infrastructure health and performance to make informed business decisions.
Implementation and Setup: LogicMonitor’s SaaS-based delivery model simplifies implementation. The agentless architecture further streamlines the setup process, eliminating the need to install agents on every monitored device. However, fine-tuning alert thresholds and escalation workflows is often necessary to avoid alert fatigue.
Pricing and Technical Requirements: LogicMonitor utilizes a complex pricing model based on the number of resources monitored, which can lead to a higher price point compared to some other network monitoring tools. Contact LogicMonitor directly for detailed pricing information. As a cloud-based solution, the primary technical requirement is reliable internet access.
Comparison with Similar Tools: While tools like Datadog and PRTG offer similar functionality, LogicMonitor differentiates itself with its comprehensive coverage of both on-premises and cloud environments, robust automation, and advanced AIOps capabilities. However, its complex pricing structure might make it less appealing for smaller organizations with limited budgets.
Pros:
- Highly automated with minimal manual configuration
- Excellent out-of-the-box monitoring capabilities
- Strong integrations with major cloud providers and IT systems
- Regular platform updates and new features
Cons:
- Higher price point compared to many alternatives
- Complex pricing model based on monitored resources
- Some users report occasional alert storms requiring tuning
Website: https://www.logicmonitor.com/
10. ThousandEyes
ThousandEyes, now owned by Cisco, offers a powerful network monitoring solution specializing in providing deep visibility into digital experiences, particularly concerning Internet and WAN performance. This makes it a crucial tool for organizations heavily reliant on cloud applications and services, especially in the AE region where internet infrastructure can vary significantly. Unlike some network monitoring tools that focus primarily on internal networks, ThousandEyes excels at monitoring external dependencies, giving you a clear picture of how internet performance impacts your users’ experience. This external focus makes it an invaluable tool for troubleshooting issues that lie outside your direct control, such as problems with ISPs, cloud providers, or SaaS platforms. Its combination of active and passive monitoring techniques allows it to measure network performance across a diverse range of environments, from cloud providers and ISPs to your internal networks. This comprehensive view of application delivery and user experience makes ThousandEyes deserving of a place on this list.
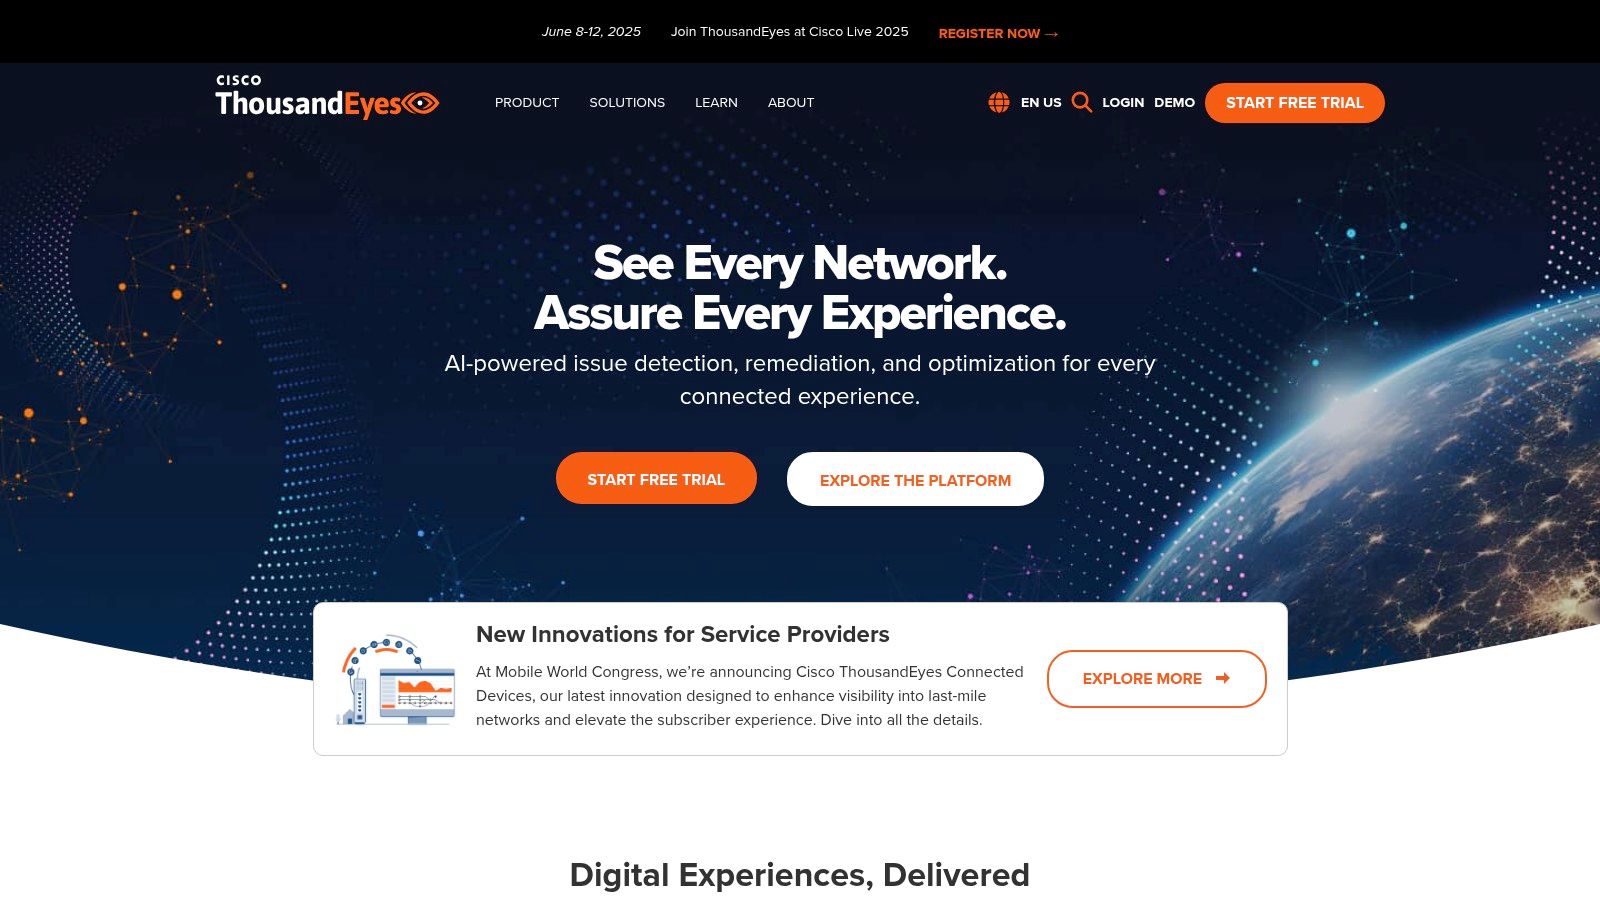
ThousandEyes offers a multi-layered approach to monitoring, covering network, routing, DNS, HTTP, and other critical protocols. This allows IT teams to pinpoint the root cause of performance bottlenecks quickly. For instance, if users in Dubai are experiencing slow access to a cloud application hosted in Europe, ThousandEyes can identify whether the issue lies with the local ISP, a transcontinental link, or the application server itself. Its global vantage points provide external performance measurements, ensuring accurate assessments regardless of user location. The real-time outage detection feature, coupled with visual path analysis, allows for rapid identification and resolution of network disruptions. Additionally, Internet Insights offers collective intelligence on overall internet health, providing valuable context for troubleshooting.
Features:
- End-to-end visibility across Internet, cloud, and enterprise networks
- Multi-layer monitoring (network, routing, DNS, HTTP, etc.)
- Global vantage points for external performance measurement
- Real-time outage detection with visual path analysis
- Internet Insights for collective intelligence on Internet health
- Powerful visualization and reporting tools
Pros:
- Unparalleled Internet visibility beyond corporate boundaries
- Excellent for troubleshooting cloud and SaaS application issues
- Intuitive interface with powerful visualization tools
- Strong integration with the Cisco ecosystem (beneficial for existing Cisco users)
Cons:
- Premium pricing model may be prohibitive for smaller organizations. Contact ThousandEyes directly for specific pricing details.
- Less focused on internal infrastructure monitoring than some alternatives (e.g., PRTG, SolarWinds).
- Can require specialized expertise to fully utilize all advanced capabilities.
Implementation/Setup Tips:
While ThousandEyes boasts an intuitive interface, maximizing its potential requires a degree of planning and expertise. Defining clear monitoring goals, identifying critical application paths, and configuring appropriate alerts are essential for effective implementation. Engaging with ThousandEyes’ support resources or certified partners can be beneficial, especially for larger and more complex deployments.
Comparison with Similar Tools:
While tools like SolarWinds and PRTG Network Monitor offer broader internal network monitoring capabilities, ThousandEyes’ strength lies in its external focus and deep internet visibility. For organizations in the AE region dealing with multiple ISPs and relying heavily on cloud applications, ThousandEyes provides critical insights that other tools may lack.
Website: https://www.thousandeyes.com/
ThousandEyes is a powerful network monitoring tool specifically designed for today’s cloud-centric world. Its focus on external dependencies makes it an essential asset for businesses operating in the AE region and beyond. While the premium pricing may not suit all budgets, its comprehensive features and unparalleled internet visibility offer significant value for organizations reliant on optimal application performance and user experience.
Top 10 Network Monitoring Tools: Core Feature Comparison
| Tool | Core Features ★ | UX/Quality 🏆 | Value Proposition 💰 | Unique Selling Points ✨ | Target Audience 👥 |
|---|---|---|---|---|---|
| Nagios | Infrastructure monitoring, alerting, plugins | Highly customizable but outdated UI | Free core version, strong community support | Extensive plugin ecosystem | Tech-savvy users, SMBs to enterprises |
| SolarWinds Network Performance Monitor | Network path analysis, customizable dashboards | Intuitive web interface with robust visualization | Scalable solution with solid device support | Advanced topology and performance monitoring | IT professionals, enterprises |
| PRTG Network Monitor | Auto-discovery, unified monitoring, mobile apps | User-friendly, intuitive interface | Flexible licensing with free version for up to 100 sensors | 250+ pre-configured sensors | SMBs to large networks |
| Zabbix | Distributed monitoring, predictive analytics, auto-discovery | Scalable with robust alerting features | Completely free, enterprise-class open-source solution | Enterprise-grade capabilities | Large enterprises, IT operations |
| Wireshark | Deep packet inspection, live capture, multi-platform | Powerful analysis yet steep learning curve | Free tool offering in-depth network analysis | Industry standard for protocol analysis | Network professionals, educators |
| Datadog Network Performance Monitoring | Real-time visualization, cloud & application performance | Modern, intuitive UI integrated within Datadog suite | Comprehensive monitoring across cloud and on-prem environments | Advanced analytics and anomaly detection | Cloud-native and enterprise IT teams |
| ManageEngine OpManager | Real-time monitoring, automated discovery, bandwidth analysis | User-friendly with minimal learning curve | Competitive pricing with extensive device templates | Integrated IP management tools | SMBs to enterprises |
| Prometheus | Time series data, flexible query (PromQL), pull-based collection | Optimized for containerized, cloud-native setups | Free, scalable toolkit for modern monitoring needs | Powerful PromQL and Grafana integration | Modern cloud and microservices teams |
| LogicMonitor | Automated discovery, pre-configured templates, AIOps capabilities | Highly automated, SaaS-based platform | Comprehensive visibility with regular updates | Agentless monitoring and integrated topology mapping | Large enterprises, hybrid IT environments |
| ThousandEyes | End-to-end Internet visibility, multi-layer monitoring, global vantage points | Intuitive interface with strong visualization | Unparalleled external network insights with Cisco integration | Extensive WAN monitoring beyond corporate boundaries | Enterprises, cloud and SaaS users |
Choosing the Right Tool for Your Needs
Selecting the optimal network monitoring tools for your organization in the AE region requires careful consideration of several factors. From open-source solutions like Nagios and Zabbix, offering cost-effective flexibility, to robust commercial platforms like SolarWinds NPM, LogicMonitor, and Datadog Network Performance Monitoring, the right choice hinges on your specific needs. This listicle explored a range of tools, each with its own strengths, from the deep packet inspection capabilities of Wireshark to the sophisticated WAN monitoring of ThousandEyes. Remember to consider your budget, network size and complexity, desired features (such as automated alerts, reporting, and visualizations), and the level of in-house expertise you have available when making your decision. Tools like PRTG Network Monitor, ManageEngine OpManager, and Prometheus offer varying degrees of scalability and customization, allowing you to tailor your monitoring strategy effectively.
Successfully implementing these network monitoring tools also requires careful planning and execution. Ensuring proper configuration, integration with existing systems, and ongoing maintenance are crucial for maximizing the value of your chosen tool. Investing in training for your team can significantly improve their ability to interpret data, identify potential issues, and proactively address network performance bottlenecks.
The right network monitoring tools empower you to maintain optimal network performance, ensure business continuity, and drive efficiency. By leveraging the insights gained from this article, you can confidently navigate the landscape of network monitoring solutions and select the perfect fit for your organization’s needs.
Ready to elevate your network monitoring capabilities? FSI Technology offers expert guidance and tailored solutions, leveraging industry-leading network monitoring tools, including Cisco networking solutions, to help businesses in the UAE achieve optimal network performance and security. Visit FSI Technology today to explore our services and schedule a consultation.
Article created using Outrank