

Unlock Peak Network Performance in 2025
A seamless network is vital for any modern business. To prevent costly downtime and ensure optimal efficiency, leveraging the right network monitoring tools is essential. This guide dives into the top 10 solutions for 2025, helping IT departments, network engineers, and business leaders in the AE region keep their infrastructure robust and responsive. You’ll discover leading network monitoring tools that provide critical insights to proactively manage, troubleshoot, and optimize your network, ensuring it supports your business goals effectively.
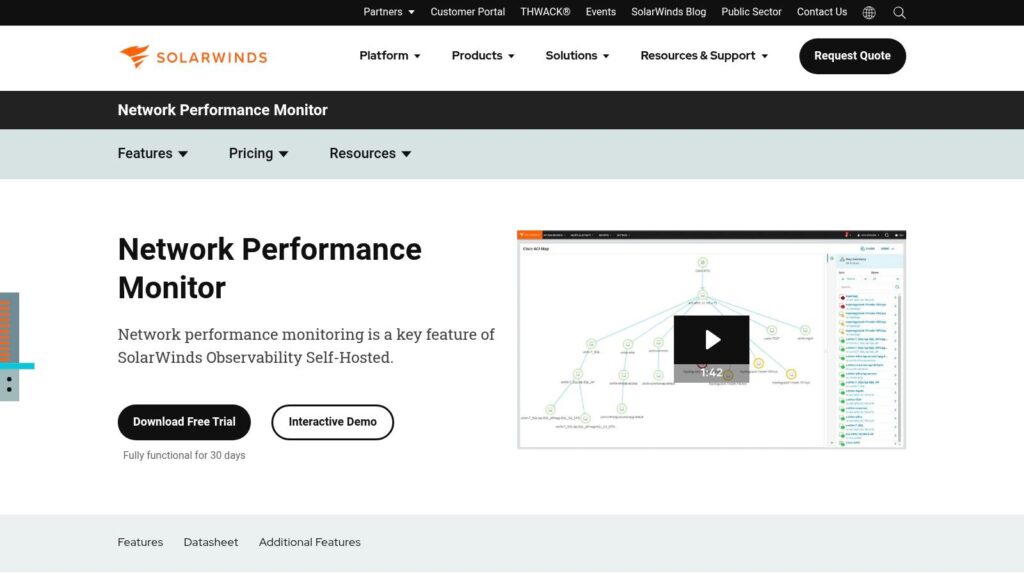
1. SolarWinds Network Performance Monitor
SolarWinds Network Performance Monitor (NPM) stands as a titan in the realm of network monitoring tools, offering a comprehensive suite designed to provide IT professionals with deep visibility and control over their network infrastructure. For businesses in the AE region, from burgeoning startups in Dubai to large enterprises in Abu Dhabi, maintaining optimal network performance is critical for daily operations, digital transformation initiatives, and delivering superior customer experiences. SolarWinds NPM delivers on this by simplifying network complexity and empowering teams to proactively identify and resolve issues.
SolarWinds NPM earns its top spot due to its robust feature set, user-friendly interface, and scalability, making it a preferred choice for a wide array of organizations. It’s particularly well-suited for environments that require detailed insights into network health, bandwidth utilization, and the performance of multi-vendor network devices, whether on-premises, in the cloud, or in hybrid deployments.
Practical Applications and Key Features:
- Automated Network Discovery and Mapping: One of NPM’s standout features is its ability to automatically discover network devices and create dynamic network maps. For rapidly expanding businesses in the AE, which might be frequently adding new equipment or office locations, this means IT teams can quickly visualize their entire network, understand device dependencies, and maintain an accurate inventory without tedious manual effort. This is crucial for efficient troubleshooting and capacity planning.
- Real-time Bandwidth Monitoring and Analysis: In a region heavily reliant on digital services and cloud connectivity, bandwidth bottlenecks can severely impact business productivity. NPM utilizes SNMP monitoring alongside technologies like NetFlow, J-Flow, sFlow, and NetStream to provide granular visibility into bandwidth usage. Network engineers can identify top talkers, applications consuming the most bandwidth (e.g., video conferencing, cloud backups, ERP systems), and patterns of traffic flow. This allows for proactive management, ensuring critical applications always have the necessary resources and helps in justifying bandwidth upgrades.
- Intelligent Alerting with Customizable Thresholds: NPM’s advanced alerting system is designed to cut through the noise. Instead of a flood of irrelevant notifications, IT teams can configure highly specific alerts based on simple or complex nested trigger conditions, defined parent/child dependencies, and network topology. For instance, a data center manager in the AE can set thresholds for latency or packet loss on critical links to cloud services, receiving immediate notification of degradation before end-users are significantly impacted. This proactive approach significantly reduces Mean Time To Resolution (MTTR).
- Network Topology Visualization and Path Analysis (NetPath™): Understanding the path data takes across the network, including beyond your own perimeter to cloud services, is vital. NPM’s NetPath feature provides hop-by-hop analysis of network paths, identifying bottlenecks and performance issues whether they reside on the internal LAN, WAN links, or within a service provider’s network. This is invaluable for troubleshooting intermittent connectivity issues to SaaS applications or geographically distributed offices across the emirates or internationally.
- Multi-Vendor Device Support: Modern networks are rarely homogenous. SolarWinds NPM excels in monitoring devices from a vast array of vendors (Cisco, Juniper, HP, Huawei, Dell, etc.) thanks to its extensive MIB (Management Information Base) database. This ensures that corporate IT departments and telecommunication service providers in the AE can manage their diverse network infrastructure from a single, unified platform, streamlining operations and reducing the need for multiple disparate network monitoring tools.
Implementation and Technical Considerations:
Setting up SolarWinds NPM typically involves installing the Orion Platform core and NPM module on a Windows Server. A SQL Server database (Express, Standard, or Enterprise) is required for data storage. The specific server resources (CPU, RAM, disk space) will depend on the scale of the monitored environment – the number of elements (nodes, interfaces, volumes). SolarWinds provides detailed deployment guides and sizing recommendations. For optimal performance, it’s advisable to dedicate sufficient resources to the monitoring server and database.
During implementation, start by allowing NPM to discover your network. Then, prioritize the configuration of alerts for critical devices and services to avoid “alert fatigue.” Utilizing features like PerfStack™ for performance analysis dashboards and integrating with other SolarWinds Orion modules (like Network Configuration Manager or NetFlow Traffic Analyzer) can provide an even more holistic view.
Pros:
- User-friendly interface: Intuitive dashboards and customizable views make it accessible even for less experienced network technicians, while providing depth for seasoned engineers.
- Comprehensive SNMP monitoring: Robust support for SNMP v1, v2, and v3 provides detailed metrics from a wide range of network devices.
- Strong vendor support and active community: SolarWinds offers extensive documentation, professional support services, and a large, active user community (THWACK) for troubleshooting and best practices.
- Scalable architecture: Designed to scale from small businesses to large, geographically dispersed enterprises, making it suitable for the diverse business landscape in the AE.
- Powerful reporting capabilities: Generate detailed reports on network performance, availability, and capacity for compliance, management review, and planning.
Cons:
- Higher cost: Compared to open-source alternatives like Nagios or Zabbix, NPM represents a more significant upfront and ongoing investment, though its feature set and ease of use often justify the cost for enterprise use.
- Resource-intensive: Larger deployments can demand substantial server resources, requiring careful planning for the monitoring server and database.
- Windows-based infrastructure: Requires a Windows Server for installation, which might be a constraint for organizations primarily running Linux environments.
- Customization limitations for very advanced scripting: While highly configurable, some advanced users seeking deep programmatic customization might find certain aspects less flexible than some open-source network monitoring tools.
Pricing: SolarWinds NPM pricing is licensed by the largest number of monitored elements (nodes, interfaces, or volumes) and typically starts around $2,995 (USD) for an entry-level license. However, for specific pricing tailored to your organization’s needs in the AE, it’s best to request a custom quote from SolarWinds or a local partner.
SolarWinds Network Performance Monitor is a powerful and reliable solution for organizations serious about maintaining a healthy and efficient network. Its comprehensive feature set, ease of use, and scalability make it a leading contender among network monitoring tools for businesses and service providers across the AE region.
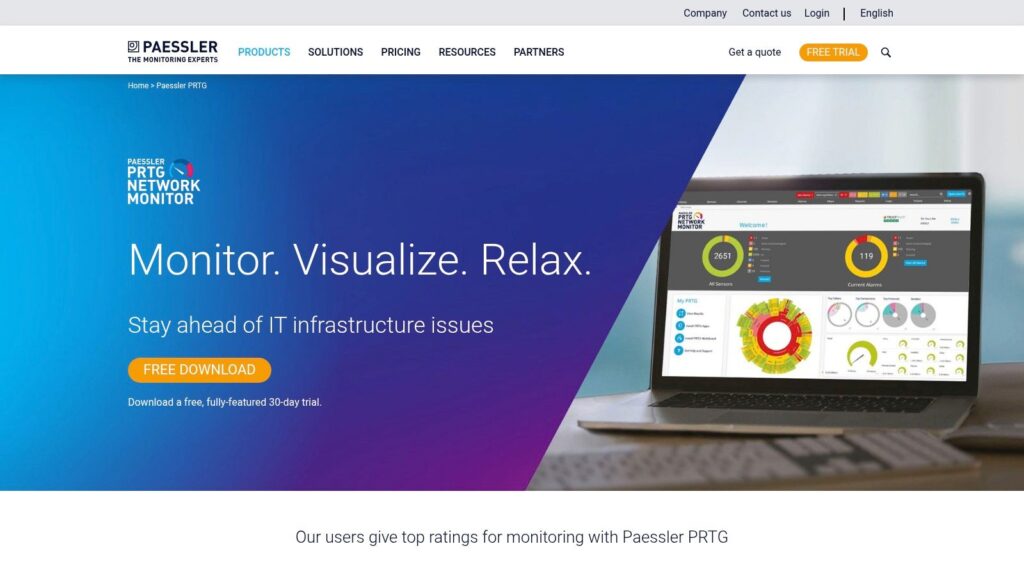
2. PRTG Network Monitor
Paessler PRTG Network Monitor stands out as a robust and comprehensive all-in-one solution in the landscape of network monitoring tools. Designed for businesses of all sizes, from small enterprises in the UAE to large corporations with distributed networks, PRTG offers a unified platform to monitor every aspect of your IT infrastructure. This includes networks, servers, applications, virtual machines, cloud services, and even Internet of Things (IoT) devices, making it a versatile choice for modern IT environments. Its strength lies in its sensor-based approach and user-friendly interface, simplifying complex monitoring tasks.
PRTG deserves its prominent place in this list due to its unique blend of extensive monitoring capabilities and remarkable ease of use. For IT departments in the dynamic AE region, where uptime and performance are paramount, PRTG provides the necessary visibility without an overly steep learning curve. Its core philosophy revolves around “sensors,” with over 200 pre-configured sensor types available out-of-the-box. Each sensor is a specific monitoring point on a device or service.
For instance, you can deploy a Ping sensor to check device availability, an SNMP CPU Load sensor for server health, an HTTP sensor for website uptime, or a Port sensor to ensure critical services are listening. This granularity allows IT professionals to tailor monitoring precisely to their needs, ensuring that all critical components of their IT infrastructure are under constant watch.
Key Features and Practical Applications:
PRTG’s feature set is designed for comprehensive oversight:
- Sensor-Based Monitoring: With 200+ sensor types, you can monitor bandwidth usage (via SNMP, WMI, xFlow), server health (CPU, RAM, disk), virtual environments (VMware, Hyper-V), database performance, email server availability, and much more. This is crucial for businesses in the AE that rely on diverse technologies. For example, a retail business can monitor its Point-of-Sale (POS) system connectivity, while a financial institution can track the performance of its critical trading applications.
- Agentless Monitoring: PRTG primarily uses agentless monitoring methods like SNMP (Simple Network Management Protocol), WMI (Windows Management Instrumentation), and packet sniffing. This simplifies deployment as no software needs to be installed on the monitored devices, reducing overhead and potential compatibility issues. For instance, network engineers can quickly add routers, switches, and firewalls for monitoring using their existing SNMP capabilities.
- Automatic Network Discovery: Upon installation, PRTG can scan your network segments and automatically discover devices, suggesting relevant sensors. This significantly speeds up the initial setup process, allowing teams to get actionable insights faster.
- Customizable Dashboards and Maps: Users can create custom dashboards displaying the most relevant metrics at a glance. The mapping feature allows for a visual representation of the network, helping to quickly localize issues. An IT manager in a Dubai-based smart building project, for example, could create a map showing the status of all connected IoT devices and network infrastructure.
- Mobile Apps (iOS & Android): PRTG offers dedicated mobile apps, enabling IT staff to receive alerts and check network status on the go. This is invaluable for teams needing to respond to incidents 24/7, a common requirement for many businesses in the AE.
- Flexible Alerting: Configure alerts via email, SMS (via third-party gateway), push notifications, or even trigger custom scripts. Thresholds can be set for various states (e.g., warning, error), ensuring timely notification before minor issues escalate.
Pricing and Technical Requirements:
PRTG’s pricing is based on the number of sensors you use, offering flexibility. They have a free version for up to 100 sensors, which is excellent for very small businesses or for testing purposes. Paid licenses start from PRTG 500 (500 sensors) and scale up to PRTG XL1 (unlimited sensors on one core server) and PRTG XL5 (unlimited sensors across five core servers for very large environments). While this model offers a low entry point, costs can escalate for extensive networks with a high density of monitored points.
The PRTG core server software runs exclusively on Windows operating systems (Windows Server 2012 R2, 2016, 2019, 2022 or Windows 10/11 for smaller installations). Remote probes, which extend monitoring reach, can be installed on Windows, Linux, and macOS, though the central management remains Windows-based. Hardware requirements for the core server depend on the sensor count, but typically a modern multi-core CPU, 8-16GB RAM, and sufficient disk space for data retention are recommended for mid-sized deployments.
Implementation and Setup Tips:
- Start Small, Scale Up: Begin with the auto-discovery feature to get an initial overview.
- Prioritize: Identify your most critical devices and applications (e.g., core switches, primary application servers, internet links) and deploy sensors to them first.
- Use Templates: PRTG offers device templates that automatically suggest relevant sensors for common hardware (e.g., Cisco routers, Windows servers).
- Tune Alerts: Adjust alert thresholds and notification methods to avoid “alert fatigue.” Only critical alerts should demand immediate attention.
- Leverage Maps: Create network maps to visualize dependencies and quickly identify the root cause of outages.
Compared to tools like Nagios, which is highly customizable but has a steeper learning curve, PRTG offers a more guided and user-friendly experience. Against more enterprise-focused solutions like SolarWinds Network Performance Monitor, PRTG often presents a more straightforward, all-in-one package that can be quicker to deploy for many common use cases. Its strength is this balance of power and simplicity. To effectively monitor your entire IT landscape, from on-premises servers to cloud resources and IoT endpoints, a comprehensive solution is vital. Learn more about PRTG Network Monitor and how it fits into a broader IT infrastructure monitoring strategy.
Pros:
- Very easy setup and intuitive configuration process.
- Flexible pricing model based on sensor count, with a generous free tier.
- Strong mobile monitoring capabilities with dedicated apps.
- Good balance of comprehensive features and user-friendliness.
- Extensive range of pre-configured sensor types.
Cons:
- Sensor-based licensing can become expensive for very large or dense networks.
- Limited advanced scripting capabilities compared to some open-source alternatives.
- Reporting features, while functional, could be more robust and customizable for in-depth analysis.
- The core server’s Windows-centric architecture might be a drawback for non-Windows environments.
Despite these considerations, PRTG Network Monitor remains a powerful and popular choice among network monitoring tools, particularly for organizations seeking an easy-to-manage, yet comprehensive view of their IT infrastructure.
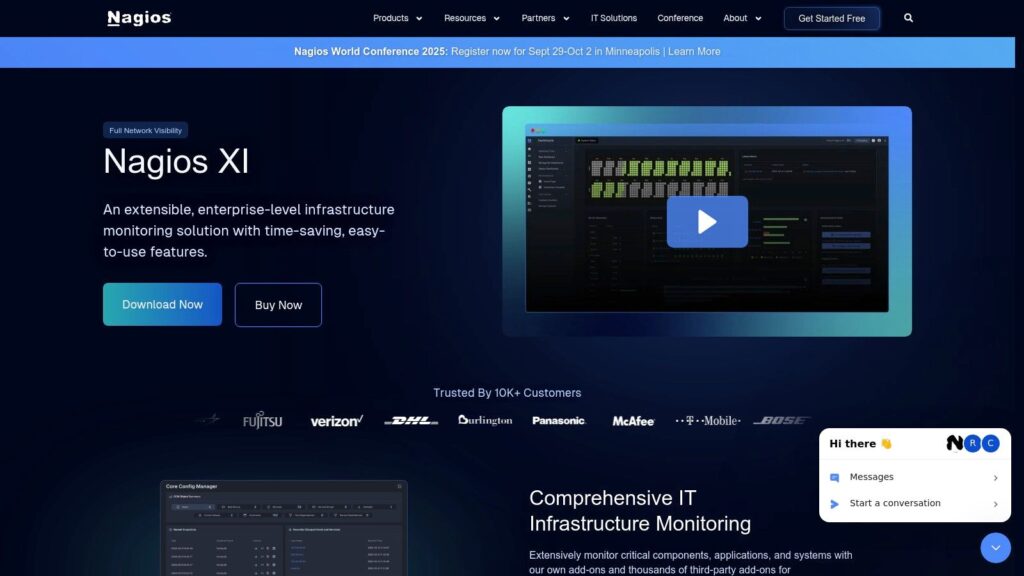
3. Nagios XI
Nagios XI stands as a formidable force in the realm of enterprise-grade IT infrastructure monitoring solutions. Built upon the robust and widely respected Nagios Core engine, Nagios XI elevates monitoring to a comprehensive level, offering organizations deep visibility into their networks, servers, applications, services, and even critical business processes. For businesses in the AE region seeking powerful network monitoring tools, Nagios XI provides the advanced alerting, insightful reporting, and proactive capacity planning features necessary to maintain operational excellence and ensure service continuity.
Nagios XI rightfully earns its place among leading network monitoring tools due to its profound adaptability, proven stability, and extensive feature set that caters to complex IT environments. For many organizations, particularly those with diverse infrastructure or highly specific monitoring needs, Nagios XI offers a solution that can be meticulously tailored.
Deep Dive into Features and Benefits
Nagios XI is packed with features designed to provide a panoramic view of your IT health:
- Comprehensive Infrastructure Monitoring Capabilities: At its core, Nagios XI excels in watching over every component of your IT landscape. This includes network devices like routers, switches, and firewalls (monitoring bandwidth, errors, uptime), servers (Windows, Linux, Unix – tracking CPU, memory, disk, running processes), diverse applications (web servers, databases, custom applications), and essential network services (DNS, DHCP, SMTP, HTTP). It can even monitor environmental factors in data centers through specialized plugins.
- Advanced Event Handling and Notification System: Swift and intelligent alerting is crucial. Nagios XI allows for highly customizable notification rules based on event severity, time periods, and contact preferences. Alerts can be dispatched via email, SMS, and integrated with team collaboration platforms like Slack or ticketing systems. Its robust escalation logic ensures that if an issue isn’t acknowledged or resolved by first-line support, it’s automatically escalated to higher-level teams or management, minimizing response times and potential impact.
- Capacity Planning and Trend Analysis: Nagios XI doesn’t just report current status; it helps predict future needs. By collecting and storing historical performance data, it generates trend graphs and reports on resource utilization (e.g., server CPU, disk space growth, network bandwidth trends). This empowers IT managers in the AE to make informed decisions about future capacity requirements, budget allocations, and system upgrades, preventing performance degradation before it affects users.
- Role-Based Access Control (RBAC) and Multi-Tenancy: Security and organizational clarity are paramount. RBAC allows administrators to define specific user roles with granular permissions, ensuring that users only see and manage the infrastructure components relevant to their responsibilities. For instance, the network team might have full access to network devices but read-only access to server metrics. Multi-tenancy extends this by allowing a single Nagios XI instance to monitor multiple, logically separated client environments, each with its own users and views—a boon for Managed Service Providers (MSPs).
- Extensive Plugin Ecosystem: One of Nagios XI’s most significant strengths is its vast library of plugins—thousands contributed by the community and Nagios Enterprises. These plugins extend monitoring capabilities to virtually any device, application, or service imaginable. From specific Cisco or Juniper hardware to AWS or Azure cloud services, and from Oracle databases to SAP systems, there’s likely a plugin available. If not, custom plugins can be easily developed.
Practical Applications and Use Cases
Nagios XI’s versatility finds application across various roles within organizations in the AE region:
- Corporate IT Departments: Use it to monitor the health of internal networks, server farms, critical applications (ERP, CRM), and ensure overall IT service availability for employees.
- Network Engineers and Technicians: Rely on it for in-depth monitoring of network infrastructure, including link status, bandwidth utilization, device performance, and latency, enabling proactive fault detection and rapid troubleshooting.
- Business Owners and Executives: Benefit from high-level dashboards and SLA reports that provide a clear overview of IT performance and its impact on business operations, ensuring services meet agreed-upon levels.
- Telecommunication Service Providers: Leverage Nagios XI to oversee vast networks of telecommunication equipment, ensuring uptime and service quality for customers across the AE.
- Data Center Managers: Employ it to monitor servers, network gear, power systems, and environmental conditions within their facilities, crucial for maintaining the integrity of hosted services.
Strengths of Nagios XI
- Highly Customizable and Extensible Platform: The ability to tailor dashboards, reports, alerts, and checks to specific organizational needs is a major advantage. Custom scripts and plugins can be integrated seamlessly.
- Strong Community Support and Plugin Ecosystem: The vast global community provides a wealth of shared knowledge, troubleshooting advice, and, most importantly, thousands of readily available plugins that extend functionality significantly.
- Proven Reliability and Stability: Built on the Nagios Core engine, which has been refined over decades, Nagios XI is known for its robustness and stability in demanding, large-scale production environments.
- Flexible Deployment Options: Organizations can choose to deploy Nagios XI on-premises for full control over their data and infrastructure, or opt for cloud-based deployments through partners for greater flexibility and reduced management overhead.
Considerations and Potential Downsides
- Steep Learning Curve for Beginners: While Nagios XI has made strides in usability over Nagios Core, its comprehensive nature and depth of configuration options can be daunting for new users.
- Interface Can Feel Dated Compared to Modern Tools: Some users find the web interface less sleek or intuitive than some newer, more aesthetically modern network monitoring tools, though it is highly functional.
- Configuration Can Be Complex for Large Environments: Managing configurations for thousands of hosts and services can become intricate, although XI’s wizards and bulk modification tools help mitigate this compared to raw Core.
- Limited Out-of-the-Box Integrations (Without Plugins): While the plugin ecosystem is a strength, core Nagios XI requires these plugins for many integrations that some competitors might offer built-in.
Implementation and Setup Tips
- Start Small and Scale: Begin by monitoring your most critical infrastructure components and gradually expand your monitoring scope.
- Leverage Wizards: Nagios XI includes numerous configuration wizards that simplify adding common devices like Windows/Linux servers, network switches, and web applications.
- Plan Your Alerting Strategy: Define clear notification preferences, contact groups, and escalation paths early on to ensure alerts are effective and not overwhelming.
- Utilize Community Resources: The extensive documentation, Nagios support forums, and community-shared knowledge are invaluable.
Pricing and Technical Requirements
Nagios XI is a commercial product with tiered pricing.
- Pricing: The Standard Edition starts at approximately $1,995 USD for monitoring up to 100 nodes. The Enterprise Edition, which includes additional features like capacity planning, audit logging, and bulk modification tools, is priced higher. Specific quotes should be obtained directly from Nagios or their regional partners.
- Technical Requirements: Nagios XI is designed to run on a dedicated Linux server (RHEL, CentOS, Debian, Ubuntu). Minimums typically involve a 64-bit OS, 2 CPU cores, 4 GB RAM, and 40 GB disk space, scaling up based on the number of monitored hosts and services.
Comparison with Similar Tools
In the landscape of network monitoring tools, Nagios XI often draws comparisons with Zabbix (powerful open-source), SolarWinds NPM (user-friendly commercial), and PRTG (all-in-one sensor-based). Nagios XI distinguishes itself with its unparalleled plugin-driven extensibility and a long history of reliability, making it exceptionally adaptable to unique or complex monitoring needs where deep customization is valued.
While Nagios XI provides crucial visibility into your network’s operational status, a holistic approach to network management also involves robust security. To further enhance your network’s integrity, understanding complementary security measures is key. For example, while Nagios XI monitors, robust network access control manages who and what can connect. You can explore such complementary strategies and Learn more about Nagios XI in the broader context of network security.
For organizations in the AE region looking for a mature, highly flexible, and powerful IT infrastructure monitoring solution, Nagios XI remains a compelling choice.
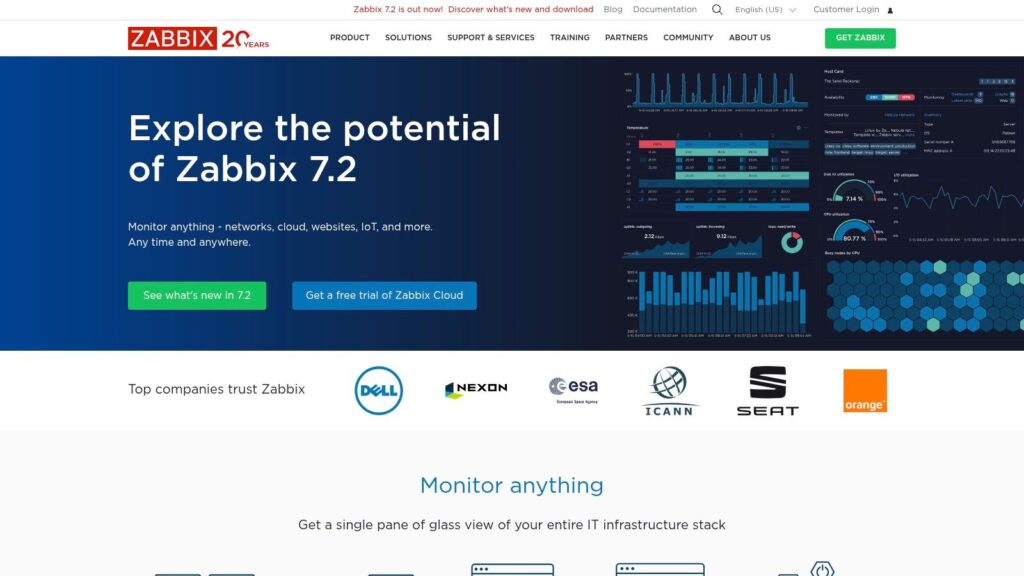
4. Zabbix
For organizations seeking a powerful, enterprise-grade solution without the hefty price tag, Zabbix stands out as a premier choice among network monitoring tools. This open-source platform delivers comprehensive, real-time monitoring capabilities spanning networks, servers, virtual machines, applications, and cloud services. Its ability to track thousands of metrics, coupled with advanced alerting, robust visualization, and detailed reporting, makes it a formidable tool for IT departments across various sectors, particularly in dynamic and growing economies like those in the AE region.
Zabbix earns its place on this list due to its sheer flexibility, scalability, and a feature set that rivals many commercial network monitoring tools. It empowers businesses in the AE region, from burgeoning startups to large-scale enterprises and governmental bodies, to gain deep visibility into their IT infrastructure, proactively identify issues, and ensure optimal performance and availability of critical services, all while maintaining control over costs.
Unpacking Zabbix’s Core Capabilities
Zabbix’s strength lies in its comprehensive and adaptable approach to monitoring:
- Versatile Data Collection: Zabbix offers both agent-based and agentless monitoring. Zabbix agents, available for most operating systems (Linux, Windows, macOS, UNIX variants), provide deep insights into OS-level metrics, application performance, and custom parameters. Agentless monitoring is achieved through standard protocols like SNMP (Simple Network Management Protocol) for network devices (routers, switches, firewalls), ICMP (Internet Control Message Protocol) for reachability, IPMI (Intelligent Platform Management Interface) for hardware-level server monitoring, and JMX (Java Management Extensions) for Java applications. This dual capability ensures that virtually any device or service within an IT environment can be monitored.
- Real-Time Insights: The platform excels at collecting and processing vast amounts of data in real time. This allows network engineers and IT administrators to observe performance trends, detect anomalies as they happen, and react swiftly to potential problems before they impact end-users or business operations. Dashboards can be customized to display critical metrics, graphs, and network maps, offering an at-a-glance overview of system health.
- Intelligent Alerting (Advanced Trigger-Based System): Zabbix features a highly sophisticated and granular trigger system. Triggers define problem thresholds based on incoming metric data. Users can create complex logical expressions for triggers, incorporate dependencies (e.g., don’t alert for a server if its parent switch is down), and establish multiple severity levels. Alerting mechanisms are diverse, including email, SMS, and integrations with modern communication platforms like Slack, Microsoft Teams, or PagerDuty, ensuring that the right personnel are notified promptly through appropriate channels. Escalation rules can automatically elevate unresolved issues to higher-level support teams.
- Centralized Web Management: The entire Zabbix configuration and data visualization is managed through a web-based interface. This provides convenient access from anywhere and simplifies administration tasks such as adding hosts, configuring items and triggers, and managing users.
- Scalable Distributed Monitoring (Proxy Support): For large or geographically dispersed environments, a common scenario for businesses in the AE region with multiple branches or international operations, Zabbix proxies are invaluable. A Zabbix proxy collects monitoring data on behalf of the Zabbix server, reducing the load on the main server and simplifying the monitoring of remote locations or isolated network segments. Proxies can buffer data locally if connectivity to the main server is lost, ensuring no data gaps.
Practical Applications: Zabbix in Action across the AE Region
Zabbix’s adaptability makes it suitable for a wide range of use cases:
- Corporate IT Infrastructure: Monitoring the health and performance of internal networks, critical servers (web, database, application), virtualized environments (VMware, Hyper-V, KVM), and storage systems. This is vital for ensuring business continuity and employee productivity.
- Telecommunications Networks: Telecom providers in the AE can leverage Zabbix to monitor their extensive network infrastructure, including routers, switches, base stations, and customer-premises equipment (CPE). It can track key performance indicators (KPIs) for services like VoIP, IPTV, and internet connectivity.
- Data Center Operations: Data center managers can use Zabbix for comprehensive oversight of all assets, including server hardware (CPU temperature, fan speed), network traffic, power distribution units (PDUs), and environmental conditions (temperature, humidity).
- Cloud and Hybrid Environments: While traditionally on-premises, Zabbix can monitor cloud resources (e.g., AWS EC2, Azure VMs, Google Cloud Platform instances) using agents, cloud provider APIs, or by monitoring services exposed to the internet. This is crucial for businesses adopting hybrid cloud strategies.
- Specialized Sector Monitoring: Businesses in retail, logistics, or even smart city initiatives can adapt Zabbix to monitor specialized devices, IoT sensors, and application workflows specific to their operations.
The Zabbix Advantage: Weighing Pros and Cons
- Pros:
- Completely Free and Open-Source: This is a significant advantage, eliminating licensing costs and allowing investment in skilled personnel or hardware instead. The total cost of ownership (TCO) can be substantially lower than commercial alternatives.
- Highly Scalable: Zabbix is designed to scale from small businesses to massive enterprises monitoring tens of thousands of devices and millions of metrics.
- Active Development and Regular Updates: A vibrant community and dedicated Zabbix SIA team ensure continuous improvement, new features, and timely security patches.
- Strong API for Automation and Integration: Zabbix provides a comprehensive API, enabling automation of configuration tasks, integration with other IT management systems (e.g., CMDBs, ticketing systems), and custom script development.
- Cons:
- Complex Initial Setup and Configuration: The power and flexibility of Zabbix come with a steeper learning curve. Initial setup and fine-tuning can be complex, especially for large or intricate environments.
- Requires Technical Expertise: To fully leverage Zabbix’s capabilities, particularly its advanced features like custom scripting, complex triggers, and API integrations, skilled IT professionals are necessary.
- Limited Commercial Support Options: While community support is strong, official commercial support from Zabbix SIA comes at a cost. For enterprises in the AE needing guaranteed SLAs, this is an important consideration. Third-party consultants also offer Zabbix services.
- User Interface Could Be More Intuitive: While highly functional, some users find the web interface less polished or intuitive than some modern commercial tools, though significant improvements have been made in recent versions.
Understanding Costs and System Needs
- Pricing: Zabbix software itself is free. Costs to consider include the hardware to run the Zabbix server, proxies, and database; the time and expertise for setup, configuration, and ongoing maintenance; and optional paid support, training, or consultancy services from Zabbix SIA or certified partners.
- Technical Requirements:
- Zabbix Server/Proxy: Typically Linux (Debian, Ubuntu, RHEL, CentOS are popular). CPU and RAM requirements scale with the number of monitored hosts and items (e.g., a medium setup might need 4-8 CPU cores, 8-16GB+ RAM). Sufficient disk space is critical for historical data.
- Database Backend: MySQL/Percona Server, PostgreSQL (often recommended for larger setups), TimescaleDB (for enhanced time-series data handling), or Oracle.
- Web Server: Apache or Nginx with PHP support.
- Zabbix Agents: Lightweight agents are available for a wide array of operating systems.
Getting Started: Implementation and Setup Insights
- Strategic Planning: Before diving in, clearly define what needs to be monitored, why, and what the key performance indicators (KPIs) and alert thresholds should be.
- Leverage Templates: Zabbix comes with numerous pre-defined templates for common operating systems, devices, and applications. Use these as a starting point and customize them to fit your specific needs.
- Mastering Alerts: Invest time in understanding and configuring triggers, severities, dependencies, and escalations to create a meaningful and actionable alerting system that avoids alert fatigue.
- Database Optimization: For larger installations, regular database tuning and maintenance are crucial for optimal Zabbix performance. Consider partitioning for older data.
- Phased Rollout: Start by monitoring a small set of critical infrastructure components. Gradually expand the scope as you gain experience and confidence with the tool.
- Community and Professional Support: Utilize the extensive official documentation and active community forums. For mission-critical deployments in the AE region, consider engaging Zabbix partners for professional services or training.
Zabbix in the Broader Ecosystem of Network Monitoring Tools
Compared to other open-source network monitoring tools like Nagios, Zabbix generally offers a more integrated experience with a built-in web interface, graphing, and a more cohesive feature set. Prometheus excels in time-series data and cloud-native environments but Zabbix provides a broader, more traditional IT infrastructure monitoring scope out-of-the-box. Against commercial giants like SolarWinds NPM or PRTG Network Monitor, Zabbix’s primary differentiator is its zero licensing cost and unparalleled customizability, though commercial tools often boast a more polished user experience and easier initial setup for common scenarios.
Zabbix provides an incredibly robust and adaptable platform, making it a compelling option for organizations that need a deep, customizable, and cost-effective network and IT infrastructure monitoring solution. Its capabilities make it a strong contender for any organization looking to enhance its operational awareness and system reliability.
5. ManageEngine OpManager
ManageEngine OpManager is a robust and comprehensive network monitoring software designed to provide IT administrators with deep visibility and control over their entire network infrastructure. It stands out as one of the highly regarded network monitoring tools, particularly for small to medium-sized businesses (SMBs) in the AE region, offering a powerful suite of features for fault and performance management across a wide array of network devices.
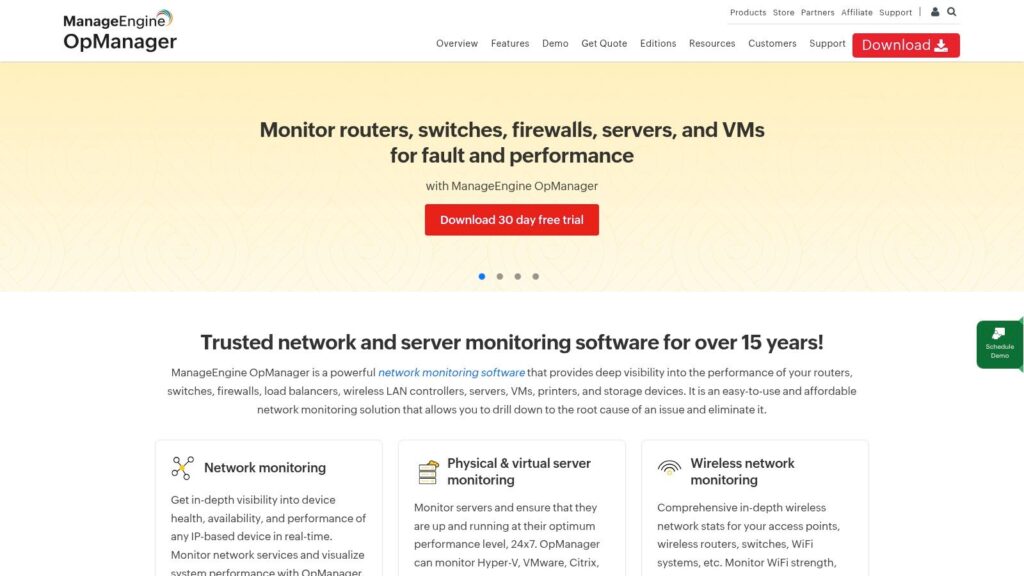
OpManager empowers network engineers and IT departments to proactively monitor and manage critical network components, including routers, switches, firewalls, servers (both physical and virtual machines – VMs), and even storage devices. Its core strength lies in its ability to automate many of the tedious tasks associated with network oversight, making it an indispensable asset for maintaining optimal network health.
Core Functionality & Key Features Deep Dive
- Automated Network Discovery and Mapping: One of OpManager’s standout features is its intelligent network discovery process. Upon installation, it can automatically scan your network, identify connected devices using ICMP, SNMP, WMI, or Telnet/SSH, and create a detailed Layer 2/Layer 3 network map. This visual representation is invaluable for understanding network topology, troubleshooting connectivity issues, and maintaining an up-to-date inventory, saving considerable manual effort and helping visualize complex network structures.
- Bandwidth Monitoring and Traffic Analysis: In today’s bandwidth-intensive environment, understanding traffic patterns is crucial. OpManager provides in-depth bandwidth monitoring and traffic analysis by leveraging flow technologies like NetFlow, sFlow, J-Flow, IPFIX, and AppFlow. This allows businesses in the AE to identify top talkers (users, applications, protocols), pinpoint applications consuming excessive bandwidth, and ensure that critical business applications receive the necessary network resources. This feature is key for optimizing network performance, planning for future capacity needs, and ensuring QoS for essential services.
- Comprehensive Fault and Performance Management: OpManager continuously polls network devices for availability and performance metrics such as CPU utilization, memory usage, disk space, interface traffic, errors, and discards. It utilizes SNMP, WMI, and CLI protocols to gather this rich data. Customizable, multi-level threshold-based alerts notify administrators of impending issues via email, SMS, or even Slack integrations before they impact end-users, facilitating proactive problem resolution and minimizing downtime.
- Configuration Backup and Change Management (NCM Integration): Network configurations are the backbone of network stability. OpManager, especially when integrated with its NCM (Network Configuration Manager) add-on, automates the backup of device configurations, tracks configuration changes in real-time, and allows for quick rollbacks to previous stable versions in case of faulty updates or unauthorized modifications. This is essential for compliance with internal policies and industry regulations (like PCI DSS), and significantly reduces the risk of outages due to misconfigurations.
- Multi-Site Monitoring with Central Console: For businesses with geographically distributed offices, a common scenario in the dynamic AE landscape, OpManager offers a centralized console to monitor multiple remote sites. This distributed monitoring capability, often using “Probe” servers at remote locations that report back to a central server, allows a central IT team to manage and troubleshoot network issues across all locations efficiently, reducing the need for on-site IT personnel at every branch.
- Extensive Device Support: With support for over 8,000 device types and more than 53,000 vendor templates, OpManager ensures that most, if not all, of an organization’s network infrastructure can be monitored from a single platform. This broad compatibility simplifies the monitoring landscape and reduces the need for multiple disparate tools.
Practical Applications and Use Cases in the AE Region
OpManager’s feature set translates into tangible benefits across various scenarios:
- SMBs in Business Hubs (e.g., Dubai, Abu Dhabi): Many SMBs require robust IT infrastructure but may lack large dedicated IT teams. OpManager provides an affordable, user-friendly solution, enabling comprehensive network monitoring to ensure smooth digital operations without significant overhead.
- Retail and Hospitality Chains: For businesses with multiple outlets, ensuring network uptime for POS systems, guest Wi-Fi, and inventory systems is critical. OpManager’s multi-site monitoring facilitates centralized oversight and quick issue resolution.
- Educational Institutions and Healthcare Facilities: These sectors rely on stable network performance for e-learning platforms and patient record systems. OpManager helps maintain this stability by monitoring network health and server performance.
- Preventing Network Downtime for Business Continuity: Network downtime is costly. OpManager is pivotal in downtime prevention by providing early warnings. By identifying and resolving issues proactively, businesses maintain operational continuity. Efficient network monitoring is a cornerstone of resilient IT; Learn more about ManageEngine OpManager and its role in mitigating such risks. This proactive stance makes it one of the essential network monitoring tools for modern enterprises.
Pricing and Technical Requirements
- Pricing Model: OpManager is licensed based on the number of devices. Editions include Standard (SMBs), Professional (medium businesses, distributed monitoring), and Enterprise (larger organizations). A free edition (up to 3 devices) and a 30-day free trial are available. Specific pricing is quote-based.
- Technical Requirements:
- OS: Windows Server (2012 R2+), Linux (RHEL, CentOS, Ubuntu, Debian).
- Database: Bundled PostgreSQL; supports external MS SQL.
- Hardware: Dual-core CPU (min), 4GB RAM (min), 30GB disk (min). Recommendations scale with network size (e.g., Quad-core, 8-16GB+ RAM for larger deployments).
Implementation and Setup Tips
- Guided Setup: The installation wizard is straightforward. Utilize the network discovery feature with appropriate credentials (SNMP, WMI) for comprehensive mapping.
- Templates & Alerts: Leverage pre-configured device templates and customize alert thresholds to reduce noise and prioritize critical notifications.
- Dashboard Customization: Create role-based dashboards displaying relevant KPIs for different teams or services.
Comparison with Similar Tools
OpManager offers a balanced alternative in the network monitoring tools market. Compared to higher-priced enterprise solutions like SolarWinds NPM, it provides strong value for SMBs. Unlike open-source tools (Nagios, Zabbix), which require more setup expertise, OpManager offers a polished UI and commercial support, making it quicker to deploy.
Pros:
- Cost-effective pricing for SMBs.
- Good integration with other ManageEngine products.
- Comprehensive device support (over 8000 types).
- User-friendly interface and setup.
- Automated network discovery and mapping.
Cons:
- Limited scalability for very large, global networks.
- Reporting capabilities could be enhanced with more advanced analytics.
- Some advanced features (e.g., NCM, APM) require additional modules or separate products.
- Less flexible in deep customization than some high-end enterprise solutions.
Why ManageEngine OpManager Deserves Its Place
ManageEngine OpManager is a standout choice due to its compelling blend of comprehensive features, user-friendliness, and affordability, particularly for SMBs and mid-market enterprises in the AE. It facilitates proactive network management, helping organizations minimize downtime, optimize resources, and ensure IT infrastructure reliably supports business goals.
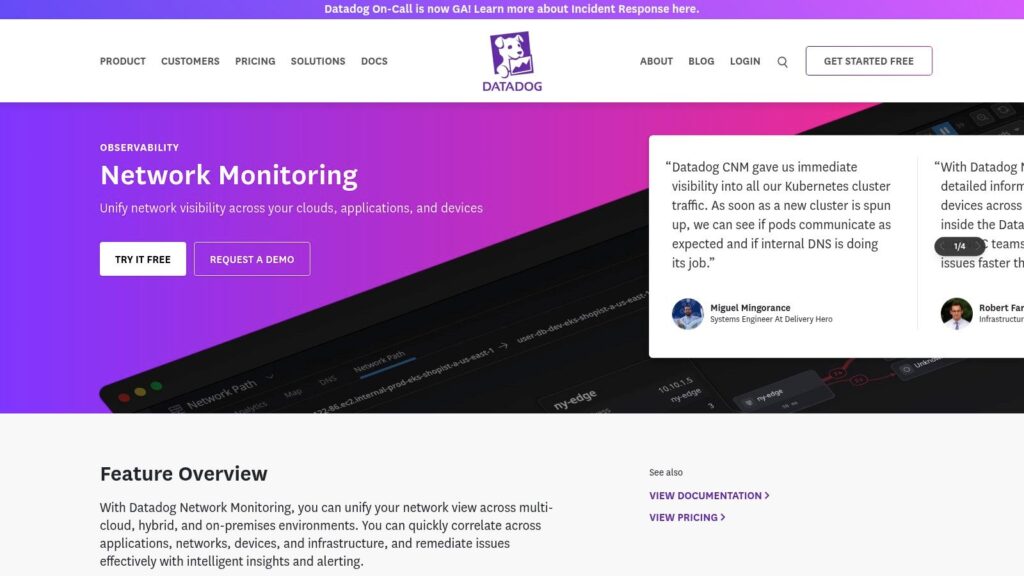
6. Datadog Network Monitoring
Datadog Network Monitoring (NPM) emerges as a leading cloud-native solution within the expansive field of network monitoring tools. It offers a unified platform for observing network performance alongside infrastructure health, application traces, and logs. This comprehensive approach provides organizations, particularly those in the AE region embracing cloud adoption, with real-time visibility into traffic flows, service dependencies, and critical metrics, all enhanced by machine learning-driven analytics.
Why Datadog NPM is a Top Choice for Network Monitoring
Datadog NPM rightfully earns its place among premier network monitoring tools due to its exceptional prowess in navigating the complexities of modern, distributed IT environments. Unlike many traditional tools that can falter with the ephemeral nature of cloud resources and intricate microservice architectures, Datadog is engineered for the cloud. It empowers IT teams and network engineers across the AE to proactively manage network health, ensuring robust service reliability and a superior digital experience, vital for the region’s dynamic economy.
Key Features and How They Translate to Benefits
Datadog NPM provides real-time network flow monitoring, capturing metadata (source/destination IP, port, volume, retransmits) for traffic between any tagged entities like hosts, containers, or services. This is vital for swiftly identifying bottlenecks and troubleshooting connectivity. Its service dependency mapping automatically visualizes communication paths in complex microservice environments, aiding in impact analysis and deployment planning. A key differentiator is its machine learning-based anomaly detection, which learns normal network behavior and flags deviations, proactively identifying issues or potential security threats. This intelligent system surpasses static thresholds.
Furthermore, Datadog’s strength is amplified by its integration with over 450 technologies, enabling powerful correlation of network data with metrics from applications, databases, and cloud providers (AWS, Azure, GCP) for a unified observability view. Its cloud-native architecture with auto-scaling ensures the monitoring platform itself scales efficiently with dynamic workloads.
Practical Applications in the AE Region
For businesses in the AE, Datadog NPM is invaluable. E-commerce platforms in Dubai can monitor traffic surges during sales events, ensuring low latency for payment gateways. Financial institutions can track secure, high-performance paths for trading applications. Key applications include:
- Hybrid Cloud Visibility: Consistent monitoring across on-premises and multi-cloud environments (AWS, Azure, GCP).
- Troubleshooting Application Slowdowns: Rapidly identifying if network issues are degrading user experience by correlating application and network data.
- Cloud Cost Optimization: Pinpointing and reducing inefficient network traffic, like excessive cross-zone data transfers, to lower cloud bills.
- Enhanced Security Posture: Detecting anomalous network activity that might indicate breaches or data exfiltration.
- Proactive Capacity Planning: Analyzing traffic trends to inform infrastructure scaling and prevent performance degradation.
Implementation and Getting Started
Setting up Datadog NPM involves deploying the lightweight Datadog Agent on hosts, VMs, or Kubernetes nodes. For smooth implementation:
- Strategic Tagging: Apply consistent tags (e.g., env:prod, service:checkout) for effective filtering, aggregation, and visualization of network data. This is crucial for making sense of complex environments.
- Phased Rollout: Begin by monitoring critical applications to quickly demonstrate value and build team familiarity.
- Utilize Integrations: Enable relevant integrations early to enrich network data with context from your entire tech stack.
Understanding Datadog’s Pricing and Technical Needs
Datadog’s pricing is primarily usage-based. Network Performance Monitoring (NPM) is often priced per host per month, while Network Device Monitoring (NDM) for SNMP devices is per device. Costs can vary with data volume and retention. Organizations should carefully estimate usage, as costs can scale with deployment size.
Technical needs include:
- Datadog Agent installation (Linux, Windows, macOS).
- Agent outbound connectivity to Datadog.
- Appropriate cloud IAM permissions.
- Sufficient system resources for the agent (designed to be lightweight).
Datadog NPM in the Competitive Landscape
Among network monitoring tools, Datadog NPM excels over traditional on-premises solutions like SolarWinds in cloud and containerized environments. While packet analyzers like Wireshark offer deep forensics, Datadog provides aggregated, historical flow views integrated with logs, traces, and metrics. Compared to other cloud observability platforms like Dynatrace, Datadog often stands out with its vast integration library, unified agent, and highly customizable dashboards, offering a comprehensive view for modern IT operations.
Advantages and Considerations
Datadog NPM offers excellent cloud and container monitoring, a vast integration ecosystem (450+), a modern, intuitive UI, and powerful ML-driven analytics. These make it a strong choice for organizations looking for deep network insights.
However, its usage-based pricing can become expensive at scale. It’s primarily cloud-focused, though on-premises NDM is available. The learning curve for advanced features can be steep, and longer data retention often requires higher-cost tiers. These factors require careful consideration during evaluation and budget planning.
Final Thoughts and Further Learning
Datadog Network Monitoring is a powerful platform for achieving deep network visibility, especially for cloud-centric organizations. Its ability to unify network data with broader observability signals is invaluable for modern IT. For corporate IT departments and network engineers in the AE region considering advanced network monitoring tools like Datadog, specialized assistance can be beneficial. Learn more about Datadog Network Monitoring and discover how expert services can help optimize its deployment.
7. WhatsUp Gold
WhatsUp Gold, by Progress Software, solidifies its position in our list of essential network monitoring tools by offering a compelling blend of comprehensive visibility and user-friendly operation, particularly appealing to organizations looking for a robust solution without the enterprise-level price tag. It provides a holistic view of network performance, device health, and application availability, making it a strong contender for IT departments in the AE (Middle East and Africa) region aiming to proactively manage their increasingly complex infrastructures.
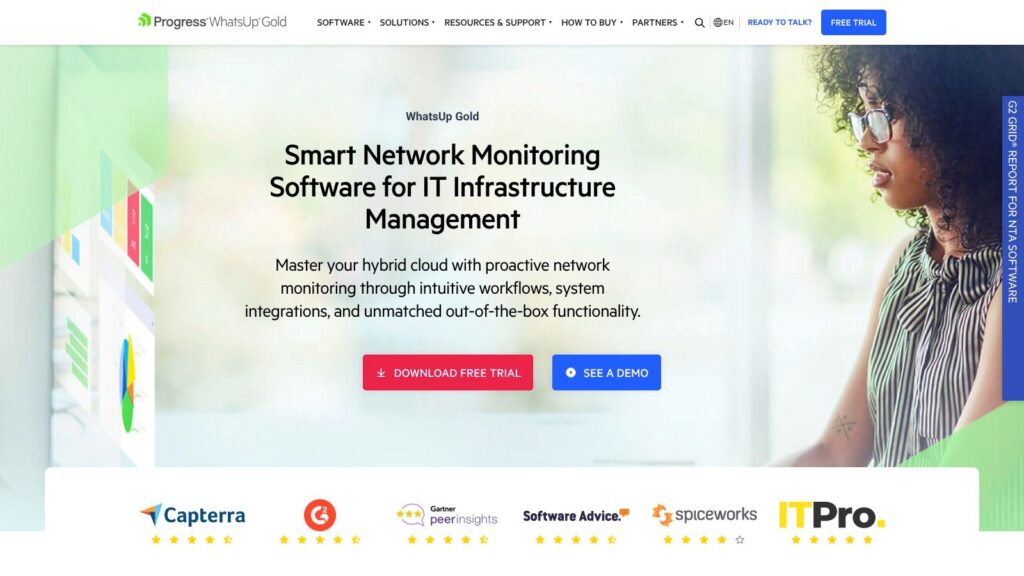
At its core, WhatsUp Gold excels in discovering, mapping, and monitoring network devices, servers, applications, and traffic flows. Its integrated approach means IT professionals can often manage diverse aspects of their infrastructure from a single console, streamlining workflows and reducing the mean time to resolution (MTTR) for network issues. This is particularly valuable in the dynamic business environment of the AE region, where agility and uptime are paramount.
Key Features and Their Practical Impact:
- Layer 2/3 Network Discovery and Mapping: WhatsUp Gold automatically discovers all devices connected to your network, including routers, switches, servers, and wireless access points. It then generates detailed Layer 2 and Layer 3 topology maps.
- Benefit & Use Case: This provides an instant, accurate visual representation of your network, which is invaluable for troubleshooting connectivity issues, planning network expansions, and identifying unauthorized devices. For businesses in the AE region undergoing rapid growth or digital transformation, this feature helps maintain an accurate inventory and understanding of their evolving network landscape.
- Wireless Network Monitoring: A standout feature, WhatsUp Gold offers in-depth monitoring of wireless LANs. It can track the performance of access points, monitor signal strength, identify connected clients, and alert on issues like rogue APs or overloaded controllers.
- Benefit & Use Case: With the proliferation of mobile devices and IoT in the AE region, robust wireless connectivity is non-negotiable. This feature helps ensure reliable Wi-Fi performance for employees and guests in corporate offices, hospitality venues, and educational institutions, directly impacting productivity and user satisfaction.
- Application Performance Monitoring (APM): The tool allows you to monitor the availability and performance of critical business applications (e.g., Microsoft Exchange, SQL Server, web applications).
- Benefit & Use Case: Proactively identify when an application is slow or unavailable before users report it. This allows IT teams to address underlying issues (server-side, network latency) quickly, minimizing business disruption for customer-facing services or internal productivity suites.
- Integrated Log Management and Analysis: WhatsUp Gold can collect, consolidate, search, and analyze log data from various network devices and systems.
- Benefit & Use Case: Simplifies security auditing, helps meet compliance requirements (important for financial and governmental organizations in the AE region), and significantly speeds up root cause analysis during incident investigation by correlating log events with performance metrics.
- Predictive Failure Analytics: By analyzing historical performance data and trends, WhatsUp Gold can forecast potential failures of network devices or systems.
- Benefit & Use Case: IT teams receive early warnings about degrading disk space, rising CPU utilization, or unusual traffic patterns that might indicate an impending failure. This enables proactive maintenance, reducing unexpected downtime and its associated costs – a critical factor for business continuity.
Practical Applications in the AE Region:
WhatsUp Gold is particularly well-suited for:
- Small to Medium-sized Businesses (SMBs) and Mid-Market Enterprises: Offering a rich feature set at a competitive price point makes it attractive for organizations in the AE region that need comprehensive monitoring without the complexity or cost of high-end enterprise solutions.
- Organizations with Extensive Wireless Deployments: Its strong wireless monitoring capabilities are a boon for sectors like hospitality, retail, education, and large corporate offices prevalent in the AE region.
- IT Teams Needing Rapid Visualization and Control: The automated discovery and mapping features are excellent for quickly understanding existing network setups or for new deployments.
- Companies Prioritizing Proactive Management: Predictive analytics and robust alerting help prevent issues, aligning with the goal of operational excellence.
Pros:
- Strong Wireless Monitoring Capabilities: As highlighted, this is a significant advantage for modern networks.
- Good Price-to-Feature Ratio: Delivers substantial value, making it a cost-effective choice among network monitoring tools.
- Comprehensive Network Discovery: Quickly identifies and maps network assets, simplifying management.
- Integrated Approach to Infrastructure Monitoring: Offers a unified view of network devices, applications, and logs.
Cons:
- Windows-Only Deployment: The core WhatsUp Gold server must be installed on a Windows machine, which might be a limitation for organizations standardizing on Linux.
- Limited Scalability for Very Large Enterprise Environments: While excellent for SMBs and mid-sized companies, extremely large, globally distributed enterprises might find its scalability stretched compared to some specialized enterprise-grade tools.
- Interface Feels Dated: Some users find the user interface less modern than some competitors, potentially leading to a slightly steeper learning curve for those accustomed to contemporary UIs.
- Fewer Third-Party Integrations Compared to Competitors: While it covers common needs, organizations with highly specialized or niche third-party tools might find integration options more limited.
Pricing and Technical Requirements:
- Pricing: WhatsUp Gold is typically licensed based on the number of devices or monitors. Pricing is available through a custom quote from Progress Software or its resellers. Editions often include Premium (basic monitoring), Distributed (for multiple sites), and Total Plus (all features, including log management, APM, and configuration management).
- Technical Requirements (General):
- Operating System: Windows Server (e.g., 2016, 2019, 2022).
- Database: Microsoft SQL Server (Express edition is often bundled for smaller deployments, Standard or Enterprise recommended for larger ones).
- Hardware: Requirements vary by network size, but typically involve a multi-core processor, 8GB+ RAM (16GB+ recommended for larger environments), and sufficient disk space for the database and logs.
Implementation and Setup Tips:
- Plan Your Discovery: Before installation, identify the IP address ranges, subnets, and necessary credentials (SNMP, WMI, SSH) for the devices you want to monitor.
- Start Small, Then Expand: Begin by discovering and monitoring your core network infrastructure (routers, switches, firewalls, critical servers) before adding less critical devices.
- Customize Dashboards and Reports: Tailor the dashboards to display information relevant to specific roles (e.g., network admin, server admin, IT manager).
- Fine-Tune Alerts: Configure alert thresholds and notification methods carefully to avoid “alert fatigue.” Focus on actionable alerts.
- Leverage Action Policies: Automate responses to certain events, such as restarting a service or running a script.
Comparison with Similar Tools:
Compared to tools like PRTG Network Monitor, WhatsUp Gold often offers a more integrated approach, especially with its log management and APM features within higher-tier editions. While PRTG is also Windows-based and popular in the SMB space, WhatsUp Gold’s Layer 2 discovery can be more detailed. Against more enterprise-focused solutions like SolarWinds Network Performance Monitor, WhatsUp Gold typically presents a more attractive price point for a comparable core feature set, though SolarWinds might offer deeper specialization in certain areas and greater scalability for massive networks.
WhatsUp Gold earns its place by providing a balanced, feature-rich network monitoring solution that delivers excellent visibility and control, particularly for organizations prioritizing comprehensive wireless monitoring and an integrated approach to infrastructure health.
8. LibreNMS
For organizations in the AE region seeking a powerful, yet cost-effective solution for network oversight, LibreNMS emerges as a compelling choice among network monitoring tools. This fully featured, open-source network monitoring system (NMS) is built by a dedicated community and offers extensive capabilities. It automatically discovers devices across your network using protocols like SNMP, CDP, LLDP, OSPF, BGP, and ARP, providing detailed insights into network health, performance, and availability. Its modern, web-based interface is mobile-responsive, allowing IT teams to stay informed whether they are at their desks or on the move.
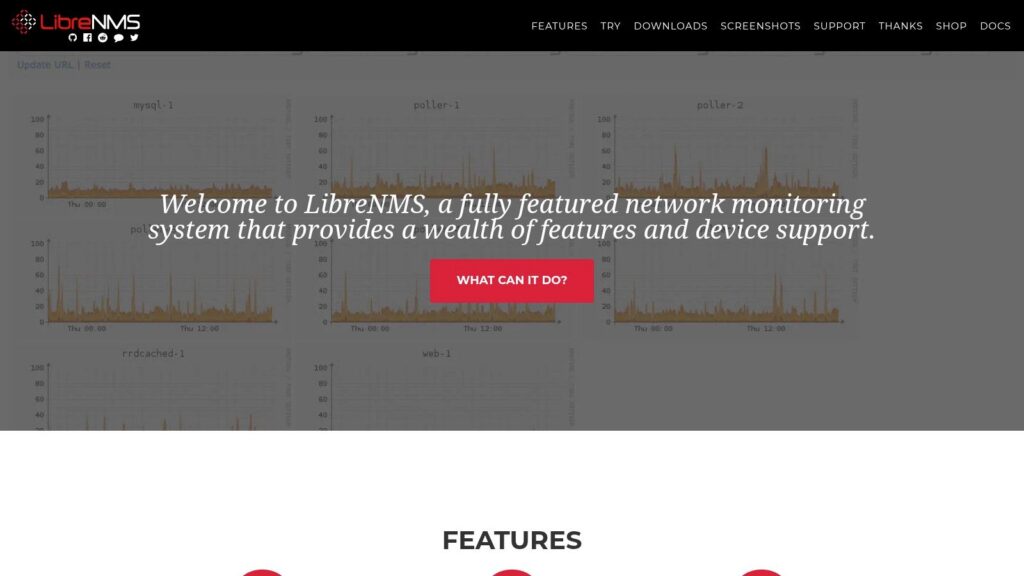
LibreNMS stands out for its comprehensive feature set typically found in commercial offerings, but without the associated licensing fees. This makes it an attractive option for businesses of all sizes, from startups to large enterprises looking to supplement or replace more expensive solutions.
Practical Applications and Use Cases:
LibreNMS serves a multitude of practical purposes across various organizational roles:
- Corporate IT Departments: For IT managers and administrators in diverse sectors like finance, retail, or logistics across the UAE, LibreNMS provides a centralized dashboard to monitor critical network infrastructure. This includes routers, switches, firewalls, servers (Linux, Windows), wireless access points, and even printers. It helps in proactively identifying bottlenecks, such as high bandwidth utilization on a switch port connecting to a critical server, or detecting a failing UPS before it causes an outage. The historical data logging allows for trend analysis, capacity planning, and SLA reporting.
- Network Engineers and Technicians: Engineers can leverage LibreNMS for in-depth troubleshooting. When users report slow network speeds, technicians can quickly examine interface statistics, error rates, and latency graphs for specific devices. The auto-discovery feature is invaluable in dynamic environments, ensuring new devices are promptly added to monitoring. Support for a vast array of network protocols like BGP and OSPF allows for monitoring routing adjacencies and stability, crucial for complex enterprise networks.
- Telecommunication Service Providers: Telcos can use LibreNMS to monitor their extensive backbone and customer-premises equipment (CPE). Its distributed polling capabilities allow it to scale across geographically dispersed networks. Monitoring key metrics like jitter, packet loss, and latency on core links is essential for maintaining service quality for subscribers. The API-driven architecture enables integration with billing systems or customer portals for automated service assurance.
- Data Center Managers: In data centers, where uptime and performance are paramount, LibreNMS can monitor environmental sensors (temperature, humidity via SNMP), power distribution units (PDUs), and the health of countless servers and network devices. Alerting on critical thresholds ensures swift action, preventing costly downtime. When deploying powerful network monitoring tools like LibreNMS, it’s essential to also consider the foundational physical layer of your network. A well-organized server rack, for instance, facilitates easier access and maintenance for the hardware LibreNMS will monitor. While not directly a LibreNMS guide, understanding related best practices for your infrastructure is beneficial; you can Learn more about LibreNMS and see how physical organization complements network visibility.
- Business Owners and Executives: While not directly interacting with the tool, business leaders benefit from the stability and performance LibreNMS helps maintain. Reduced network downtime translates to uninterrupted business operations, sustained employee productivity, and enhanced customer satisfaction, ultimately protecting revenue and reputation.
Features and Benefits Highlighted:
- Automatic Network Discovery: Significantly reduces manual configuration effort. It scans specified IP ranges or uses discovery protocols to find and add devices, identifying their OS, hardware, and available MIBs.
- Support for Thousands of Device Types: Thanks to its community-driven nature, LibreNMS supports a vast range of hardware from vendors like Cisco, Juniper, HP, Dell, Mikrotik, and many more, often with specific MIBs pre-configured.
- API-driven Architecture: Allows for extensive customization and integration with other IT management systems, ticketing platforms, or custom dashboards.
- Mobile-Responsive Web Interface: Provides clear, actionable data on any device, facilitating remote monitoring and quick responses to alerts.
- Distributed Polling: Enables scaling for large and geographically dispersed networks by distributing the polling load across multiple poller instances, all reporting back to a central LibreNMS server. This is particularly useful for organizations with branch offices or extensive infrastructure.
- Alerting System: Highly configurable alerting via email, Slack, Telegram, and other notification channels ensures that IT teams are promptly informed of issues.
Pricing and Technical Requirements:
- Pricing: LibreNMS is completely free and open-source (FOSS) under the GPLv3 license. There are no licensing fees, subscription costs, or limitations on the number of devices or sensors.
- Technical Requirements:
- Server: A Linux-based server is required. Common distributions include Ubuntu, Debian, CentOS, or RHEL.
- Software Stack: Web server (Nginx or Apache), PHP, MariaDB/MySQL database, and SNMP tools.
- Resources: Requirements vary based on the number of devices and polling frequency. A modest virtual machine (e.g., 2 vCPUs, 4GB RAM, 50GB disk) can monitor hundreds of devices, but larger deployments will need more resources.
- Expertise: Familiarity with Linux command-line interface, web server, and database administration is necessary for setup and ongoing maintenance.
Implementation and Setup Tips:
- Dedicated Server/VM: Run LibreNMS on a dedicated server or virtual machine for optimal performance and easier troubleshooting.
- Follow Official Documentation: The official LibreNMS documentation (docs.librenms.org) provides detailed installation guides for various Linux distributions.
- SNMP Configuration: Ensure SNMP (v2c or v3 for better security) is correctly configured on all network devices you intend to monitor. Use strong community strings or SNMPv3 credentials.
- Start Small: Begin by adding a few critical devices to get familiar with the interface and alerting mechanisms before rolling it out network-wide.
- Tune Polling and Discovery: Adjust polling intervals and discovery schedules based on your network’s size and sensitivity to monitoring traffic.
- Leverage the Community: The LibreNMS community forum and Discord server are excellent resources for support, troubleshooting, and sharing configurations.
Comparison with Similar Tools:
Compared to other open-source network monitoring tools like Zabbix or Nagios, LibreNMS is often praised for its easier initial setup for SNMP-based device monitoring and its modern, user-friendly web interface. While Zabbix might offer more flexibility in certain complex agent-based scenarios, LibreNMS excels in auto-discovery and out-of-the-box support for a vast range of network hardware. Unlike commercial solutions like SolarWinds NPM or PRTG Network Monitor (which has a limited free tier), LibreNMS offers full functionality without any cost, making it a strong contender for budget-conscious organizations that have in-house Linux expertise.
Why LibreNMS Deserves Its Place:
LibreNMS earns its spot on this list due to its potent combination of comprehensive features, zero cost, active development, and extensive hardware support. It democratizes network monitoring, providing enterprise-grade capabilities to organizations that might otherwise be unable to afford commercial solutions.
Pros:
- Completely free and open-source.
- Active community development ensures continuous improvement and new device support.
- Modern, intuitive, and mobile-responsive web interface.
- No licensing restrictions or costs, allowing unlimited device monitoring.
- Excellent auto-discovery and broad device compatibility.
Cons:
- Requires Linux expertise for setup and maintenance.
- Limited commercial support options; relies primarily on community support.
- Documentation, while extensive, can sometimes be inconsistent or lag behind development.
- May lack some advanced enterprise features or polished integrations found in mature commercial solutions (e.g., advanced application performance monitoring out-of-the-box).
For organizations with the technical skills to deploy and manage a Linux-based application, LibreNMS offers an incredibly powerful and versatile network monitoring system.
9. Auvik
Auvik positions itself as a user-friendly, cloud-based solution in the competitive landscape of network monitoring tools. Designed with IT service providers (MSPs) and internal IT departments in mind, particularly those in dynamic business environments like the AE region, Auvik emphasizes rapid deployment and operational simplicity. It aims to take the complexity out of network visibility by providing automated discovery, real-time insights, and up-to-date documentation, all accessible from a centralized cloud platform.
Auvik carves out a significant niche among network monitoring tools due to its relentless focus on ease of use and its powerful capabilities tailored for Managed Service Providers. In a world where IT environments are increasingly complex and skilled network engineers can be scarce, Auvik’s promise of “getting started in under an hour” is highly attractive.
Unlike traditional network monitoring tools that often demand extensive setup and deep technical expertise, Auvik’s cloud-native architecture and automated processes bypass many of these hurdles. This makes it an invaluable asset for MSPs managing multiple client networks across diverse locations, such as those in the bustling business hubs of the AE region, or for internal IT teams in mid-sized enterprises needing robust monitoring without a steep learning curve. Its ability to automatically map and document networks alone saves countless hours, making it a strong contender for organizations seeking efficient network monitoring tools.
Key Features and Benefits:
Auvik’s feature set is designed for efficiency and comprehensive network oversight:
- Cloud-Based Deployment with No On-Site Hardware: The core platform is cloud-hosted, eliminating the need for dedicated on-premise servers. A lightweight collector deployed within the client’s network securely transmits data. This model offers scalability, remote accessibility (crucial for MSPs and distributed teams), and reduced infrastructure overhead, making it one of the more accessible network monitoring tools.
- Automated Network Mapping and Documentation: Auvik excels at automatically discovering network devices (routers, switches, firewalls, servers, etc.) and generating dynamic, accurate network topology maps. This visual representation, coupled with continuously updated documentation, is invaluable for troubleshooting, planning, and maintaining an accurate inventory – a significant time-saver.
- Real-Time Alerting and Notifications: The platform provides real-time monitoring of network device health, performance metrics (CPU, memory, bandwidth utilization), and service availability. Customizable alerts notify administrators of issues like device-down events, high latency, or configuration changes via email, SMS, Slack, Microsoft Teams, or PSA integrations, enabling proactive problem resolution.
- Network Backup and Configuration Management: Auvik automates the backup of configurations for critical network devices. It also tracks changes, allowing for comparisons between versions and quick restoration in case of device failure or misconfiguration, enhancing network resilience and compliance.
- Multi-Client Management for MSPs: This is a cornerstone of Auvik. The platform offers a true multi-tenant dashboard, allowing MSPs to efficiently manage and monitor numerous client networks from a single interface. Features like per-client reporting and branding bolster an MSP’s service delivery.
Practical Applications and Use Cases in the AE Region:
Auvik’s capabilities are particularly relevant for businesses in the Arab Emirates:
- Managed Service Providers: MSPs across Dubai, Abu Dhabi, and other Emirates can leverage Auvik to standardize their network monitoring services, onboard clients faster, and provide proactive support to diverse businesses, from SMEs in free zones to larger local enterprises.
- Mid-Sized Enterprises: Companies in sectors like hospitality, retail, or logistics with lean IT teams can use Auvik for comprehensive, easy-to-manage network oversight. For example, a retail chain with stores across the UAE can centrally monitor PoS network connectivity and in-store Wi-Fi.
- Organizations with Distributed Offices: Businesses with a head office in a major city like Dubai and branch offices in other Emirates or GCC countries can benefit from Auvik’s centralized cloud platform for unified visibility and management of their entire network.
- Rapidly Scaling Businesses: For fast-growing tech companies or expanding businesses common in the AE, Auvik’s cloud-based nature offers the scalability needed to adapt their network monitoring tools without major infrastructure overhauls.
Implementation and Setup:
Setting up Auvik is designed for speed:
- Deploy one or more lightweight Auvik collectors (Windows, Linux, or virtual appliance) on the target network(s).
- Provide necessary credentials (SNMP, WMI, CLI) for device access.
- Auvik automatically discovers devices, maps the network, and begins monitoring.
- Customize alerts and integrate with existing tools (PSA, communication platforms).
Ensure network devices are configured for SNMP and firewall rules allow collector communication.
Pricing:
Auvik uses a subscription-based model, typical for SaaS network monitoring tools. Pricing is generally based on the number of “billable” network devices (routers, switches, firewalls). Specific pricing is quote-based, tailored to the network size and features required (e.g., Essentials vs. Performance tiers). Contact Auvik directly for a personalized quote.
Technical Requirements:
- Collector: Windows Server/Desktop, Linux, or virtual appliance with modest CPU, RAM (4GB+), and disk space.
- Device Access: SNMP (v1, v2c, v3) enabled on monitored devices. CLI (SSH/Telnet) for configuration backups. WMI for Windows systems.
- Internet Connectivity: The collector requires stable outbound internet access (HTTPS/443) to the Auvik cloud.
Comparison with Similar Tools:
Compared to more traditional, often on-premise network monitoring tools like Nagios or Zabbix, Auvik offers significantly faster deployment and a more intuitive interface, albeit with less granular customization. Against other cloud solutions, Auvik’s strength lies in its deep network infrastructure focus and exceptional MSP features. While tools like SolarWinds NPM are comprehensive, Auvik often wins on simplicity and speed for its target market.
Pros:
- Extremely quick and easy to deploy and configure.
- Superb multi-tenant capabilities for MSPs.
- Automated network mapping and documentation are significant time-savers.
- Intuitive interface and good mobile app functionality.
Cons:
- Subscription costs can accumulate, especially for larger networks.
- Offers fewer deep customization options compared to some enterprise or open-source tools.
- Reliant on internet connectivity for the cloud dashboard and full functionality.
- May offer less comprehensive monitoring for highly specialized or non-standard devices.
Auvik earns its spot as a valuable network monitoring tool by offering a potent combination of simplicity, speed, and powerful automation, especially for MSPs and IT teams who prioritize operational efficiency and clear network visibility. Its cloud-native approach makes it a modern solution well-suited for the dynamic IT environments found in the AE region.
10. Icinga
For organizations seeking a robust, adaptable, and powerful open-source solution to oversee their complex IT environments, Icinga stands out as a premier choice among network monitoring tools. Originating as a fork of Nagios, Icinga has evolved significantly, carving its own path with a modern architecture designed for scalability and extensibility. It comprehensively checks the availability of network resources, promptly notifies users of outages, and meticulously generates performance data, crucial for insightful reporting and proactive management. This makes it an invaluable asset for IT departments across the AE region, where digital transformation and infrastructure growth demand sophisticated monitoring capabilities.

Icinga earns its place on this list due to its unique blend of traditional host and service monitoring with modern metrics-based approaches, all within a highly scalable and customizable framework. It’s particularly well-suited for organizations that have outgrown simpler tools or require deep integration with their existing DevOps toolchains and automation workflows. For businesses in the AE region, from burgeoning tech startups to established enterprises and telecommunication providers, Icinga offers the flexibility to monitor everything from basic network connectivity to complex business processes, ensuring operational continuity and performance optimization.
Core Capabilities and Features Driving Network Visibility
Icinga’s strength lies in its comprehensive feature set, designed to meet the demands of modern IT infrastructure monitoring:
- Scalable and High-Performance Monitoring Engine (Icinga Core): At its heart, Icinga Core is engineered for speed and efficiency. It can handle tens of thousands of checks per minute, making it suitable for monitoring vast and distributed network environments. Its architecture supports distributed monitoring setups with master, satellite, and agent nodes, allowing organizations to scale their monitoring infrastructure horizontally as their network grows. This is particularly beneficial for companies in the AE region experiencing rapid expansion.
- Modern Web Interface (Icinga Web 2): A far cry from legacy monitoring interfaces, Icinga Web 2 offers a clean, intuitive, and highly customizable dashboard. Users can create custom views, dashboards, and reports, tailoring the interface to their specific needs. It provides a clear overview of network health, detailed host and service status, and powerful filtering capabilities, allowing network engineers to quickly identify and troubleshoot issues.
- Flexible Configuration and Automation Support: Icinga offers multiple ways to manage configurations. While traditional text-based configuration files are supported, the Icinga Director module provides a web-based GUI for managing hosts, services, and notifications, significantly simplifying setup and ongoing management. Furthermore, Icinga integrates seamlessly with configuration management and automation tools like Ansible, Puppet, and Chef, enabling “monitoring as code” practices and fitting perfectly into DevOps workflows.
- Business Process Modeling: Beyond monitoring individual network devices or services, Icinga allows you to model and monitor entire business processes. For example, an e-commerce company in Dubai could model its online ordering process, with Icinga tracking the health of web servers, application servers, databases, and payment gateways involved. If any component fails, Icinga can alert on the impact to the overall business process, not just the individual IT component.
- Integration with Popular DevOps Tools: Icinga excels in its ability to integrate with a wide ecosystem of tools. It can send metrics to time-series databases like Graphite or InfluxDB, integrate with logging solutions like Elasticsearch, and visualize data using Grafana. This allows for a consolidated view of system performance and health, combining Icinga’s status monitoring with deeper analytics.
Practical Applications and Use Cases in the AE Region
Icinga’s versatility makes it applicable across various scenarios relevant to the AE’s dynamic business landscape:
- Enterprise IT Infrastructure Monitoring: Large corporations in financial hubs like Abu Dhabi or Dubai can leverage Icinga to monitor their extensive networks, servers (Windows, Linux, Unix), applications, and databases, ensuring critical business systems are always available and performing optimally.
- Telecommunication Service Providers: For telcos across the AE, Icinga can monitor network backbones, routers, switches, cellular infrastructure, and customer-facing services, helping to maintain high uptime and meet stringent Service Level Agreements (SLAs).
- Cloud and Hybrid Environments: As businesses in the region adopt cloud services (AWS, Azure, Google Cloud) alongside their on-premises infrastructure, Icinga provides a unified monitoring solution to oversee resources across these hybrid environments.
- Managed Service Providers (MSPs): MSPs in the AE can use Icinga’s multi-tenancy features to monitor the infrastructure of multiple clients from a centralized platform, offering proactive support and detailed reporting.
- E-commerce and Digital Services: With the rapid growth of e-commerce and digital services in the region, Icinga helps ensure the continuous availability and performance of websites, applications, and underlying infrastructure, directly impacting customer experience and revenue.
Implementation, Pricing, and Technical Considerations
Implementation Tips:
Successfully deploying Icinga, like many powerful network monitoring tools, requires planning:
- Define Scope: Clearly identify what needs to be monitored (hosts, services, applications, network devices) and establish baseline performance metrics and alert thresholds.
- Utilize Icinga Director: For most new deployments, using the Icinga Director module is highly recommended. It simplifies configuration through a web interface, reducing the learning curve associated with manual configuration files.
- Start Small, Scale Out: Begin by monitoring a critical subset of your infrastructure and gradually expand. This allows your team to become familiar with Icinga’s capabilities and refine configurations.
- Leverage the Community: The Icinga community is active and provides a wealth of knowledge through forums, documentation, and plugins.
Pricing:
Icinga is an open-source project, meaning the software itself is free to download and use. However, organizations should budget for:
- Hardware/Infrastructure: Servers (physical or virtual) to run Icinga Core, Icinga Web 2, and any associated databases.
- Implementation & Training: Costs associated with staff training or hiring external consultants for setup and customization, especially for complex environments.
- Optional Commercial Support: While community support is strong, Icinga and its partners offer commercial support packages for organizations requiring guaranteed response times and expert assistance.
Technical Requirements:
- Operating System: Icinga Core and Icinga Web 2 primarily run on Linux distributions (e.g., Debian, Ubuntu, CentOS, RHEL).
- Software Dependencies: A web server (Apache or Nginx), PHP, and a database (MySQL/MariaDB or PostgreSQL) are required for Icinga Web 2.
- Hardware: Requirements vary significantly based on the scale of the monitored environment. A small setup might run on a VM with 2 vCPUs and 4GB RAM, while large deployments monitoring thousands of hosts and services will require more powerful dedicated servers and potentially a distributed architecture.
Comparison with Similar Tools
- Nagios: As Icinga’s progenitor, Nagios shares a conceptual foundation. However, Icinga offers a more modern web interface, generally better performance and scalability out-of-the-box, and more streamlined configuration options, especially with Icinga Director.
- Zabbix: Another popular open-source monitoring solution, Zabbix provides an all-in-one package that can be quicker to get started with for some use cases. Icinga is often considered more modular and can be more deeply customized, particularly for complex integrations and very large-scale deployments. Both require significant technical expertise.
Pros and Cons
Pros:
- Open-source with strong community support: Free to use with a wealth of shared knowledge and plugins.
- Highly scalable and performant: Capable of monitoring extensive and complex IT environments.
- Modern architecture and interface: Icinga Web 2 offers a user-friendly and customizable experience.
- Good integration with automation tools: Fits well into DevOps practices and CI/CD pipelines.
Cons:
- Requires significant technical expertise: The learning curve can be steep, especially for advanced configurations.
- Complex configuration for beginners: While Icinga Director helps, initial setup and deep customization can be challenging.
- Limited commercial support: Official commercial support is available but might not be as extensive as that for proprietary tools.
- Documentation can be overwhelming for new users: Due to its vast capabilities, navigating the documentation can be daunting initially.
In conclusion, Icinga is a formidable network monitoring tool for organizations in the AE region that need a powerful, flexible, and scalable open-source solution. While it demands technical proficiency, its comprehensive features, modern interface, and strong automation support make it an excellent investment for effectively managing today’s intricate IT landscapes.
Top 10 Network Monitoring Tools Comparison
| Solution | Core Features ✨ | User Experience ★★★★☆ | Value Proposition 💰 | Target Audience 👥 | Unique Selling Points 🏆 |
| SolarWinds Network Performance Monitor | Automated discovery, bandwidth analysis, multi-vendor support | Intuitive dashboards, scalable architecture | Premium cost, enterprise-ready | Large enterprises, IT pros | Extensive MIB database, strong vendor support |
| PRTG Network Monitor | 200+ sensors, agentless monitoring, mobile apps | Easy setup, flexible dashboards | Pay-per-sensor model, scalable | SMBs to enterprises | Mobile monitoring, simple configuration |
| Nagios XI | Infrastructure & business process monitoring, plugins | Reliable but dated UI, complex setup | Highly customizable, flexible deployment | Experienced IT teams | Extensive plugin ecosystem, capacity planning |
| Zabbix | Open-source, agent-based/agentless, distributed proxy | Scalable but complex setup, less intuitive UI | Free, active development | Tech-savvy organizations | Fully free, strong API & automation |
| ManageEngine OpManager | Automated mapping, config management, multi-site | User-friendly, good integrations | Cost-effective for SMBs | SMBs and mid-market | NCM integration, extensive device support |
| Datadog Network Monitoring | Cloud-native, ML anomaly detection, 450+ integrations | Modern UI, powerful analytics | High cost at scale | Cloud-focused enterprises | ML-based analytics, cloud auto-scaling |
| WhatsUp Gold | Layer 2/3 discovery, wireless monitoring, log management | Good wireless features, dated interface | Competitive pricing | SMBs, limited enterprise use | Predictive failure analytics |
| LibreNMS | Open-source, auto-discovery, mobile-responsive | Modern interface, requires Linux skills | Completely free | Open-source enthusiasts | API-driven, large device support |
| Auvik | Cloud-based, multi-client MSP management | Easy deployment, mobile app support | Subscription model | MSPs and IT teams | Auto network documentation, cloud-native |
| Icinga | Scalable monitoring, business process modeling | Modern UI, steep learning curve | Open source, limited commercial support | Skilled IT professionals | DevOps integration, high performance engine |
Empower Your Network with the Right Tools & Expertise
Navigating the landscape of network monitoring tools can be complex, but as we’ve explored, a wealth of powerful solutions—from SolarWinds Network Performance Monitor and PRTG Network Monitor to Nagios XI, Zabbix, and ManageEngine OpManager—are available to organizations across the AE region. The key takeaway is that the optimal choice isn’t universal; it’s deeply rooted in your unique operational needs, the scale of your network infrastructure, and your available budget. Each tool, including options like Datadog Network Monitoring, WhatsUp Gold, LibreNMS, Auvik, and Icinga, offers a distinct pathway to achieving enhanced network visibility and proactive control.
Selecting from these leading network monitoring tools depends on your organization’s specific requirements. When making your decision, consider factors such as the complexity of your IT environment, the specific metrics you need to track, integration capabilities with your existing systems, and the level of technical expertise within your team. Successful implementation also hinges on proper configuration, defining clear alerting thresholds, and ensuring your team is proficient in utilizing the chosen platform.
For businesses in the UAE aiming to pair powerful monitoring with robust Cisco infrastructure, FSI Technology stands as a leading Cisco solution provider. With over 20 years of experience, we offer authentic Cisco products and expert guidance from certified engineers for selection, configuration, and deployment of your foundational network, along with 24X7 support. This strong foundation is crucial for any effective network monitoring strategy.
Your actionable next steps should include:
- Clearly define your monitoring objectives: What critical aspects of your network do you need to see, measure, and improve?
- Evaluate tool capabilities: Match the features and strengths of the discussed network monitoring tools against your defined objectives and infrastructure.
- Plan for integration and support: Consider how new tools will fit into your existing ecosystem and ascertain the level of vendor or community support you’ll require.
By investing in the right network monitoring tools and complementing them with the right expertise, you empower your organization to proactively manage performance, minimize costly downtime, and build a resilient, high-performing network that truly propels your business forward in today’s dynamic digital landscape.
Supporting IT AMC (Annual Maintenance Contract) services for network monitoring tools involves ensuring the consistent health, performance, and reliability of tools such as Nagios, Zabbix, SolarWinds, or PRTG. This includes preventive maintenance like regular health checks, verifying alert mechanisms, backing up configurations, updating software and patches, and optimizing thresholds.
To ensure your network infrastructure is perfectly primed for advanced monitoring and optimized performance, partner with the experts. FSI Technology can help you build and maintain a robust Cisco-powered network, creating the ideal environment for your chosen network monitoring tools to excel. Explore FSI Technology’s solutions and let our certified engineers guide you in fortifying your network’s foundation.